



On the afternoon of Wednesday 29 July 2026 the yield on the ten-year BTP was hovering around 3.98% and that of the German Bund around 3.14%: between the two there were just over eighty basis points, that is eight tenths of a percentage point. This is the spread, the word that in the years of the debt crisis opened the television news and that today, through sheer repetition, is often cited without really knowing what it measures.
This guide explains what it is, how it is read, what moves it and — above all — what the most common errors of interpretation are. The figures cited are anchored to their respective dates: the spread changes every day, the mechanisms that govern it do not.
What it really measures
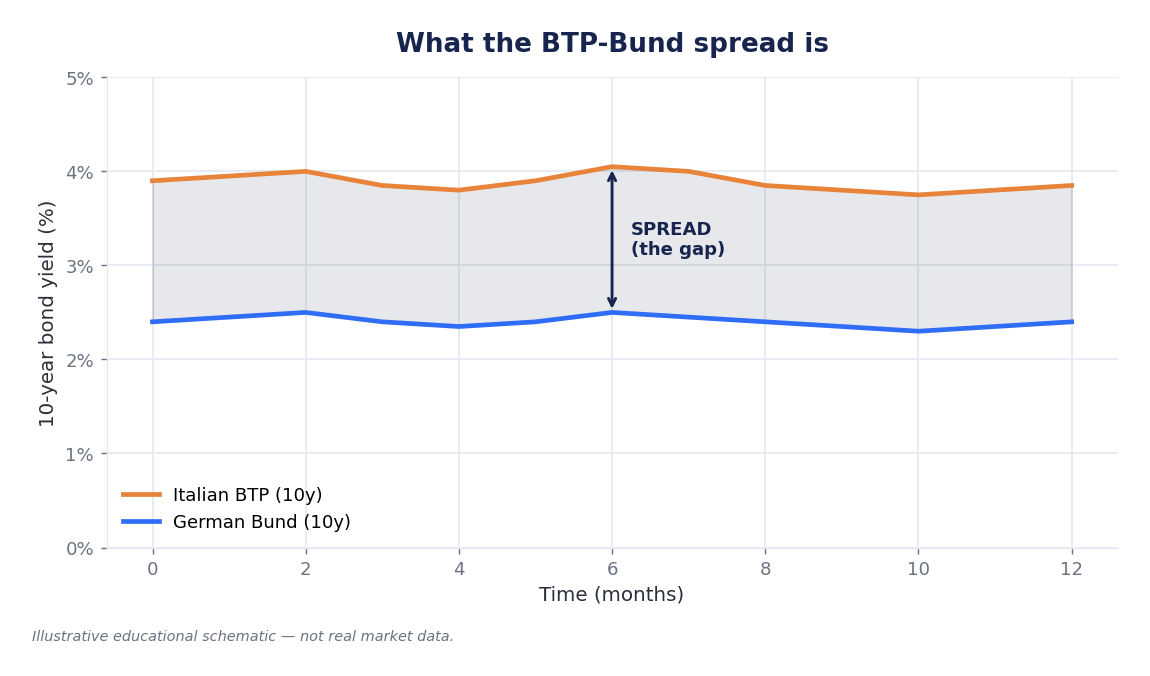
The BTP-Bund spread is the difference between the yield on the ten-year Italian government bond and that on the ten-year German government bond, expressed in basis points. A basis point is one hundredth of a percentage point: 100 basis points are equivalent to 1%.
The Bund is used as the benchmark because Germany is considered the soundest issuer in the euro area: same market, same currency, same central bank, but a credit risk perceived as minimal. Comparing two ten-year bonds in euro serves precisely to isolate a single variable: how much more investors demand from Italy to lend it money at the same maturity. This extra amount is the risk premium.
Beware of a detail that almost always escapes notice: the spread is not the cost of Italian debt. The cost is the full yield (the 3.98% of 29 July 2026), of which the spread represents only the additional portion relative to Germany. A low spread with high yields costs the State more than a high spread with very low yields. That is exactly what has happened in recent years.
The risk premium and the level of rates are two different things
The quickest way to understand this is to look at what happened in the first half of 2026. According to the monthly data of the European Central Bank, the average yield on the ten-year BTP moved from 3.388% in February to 3.734% in June: about 35 basis points more. Yet the spread, over the same period, rose only from 64 to 77 basis points, because the Bund also became more expensive (from 2.744% to 2.964%).
The explanation lies in monetary policy. After bringing the deposit rate to 2.00% on 11 June 2025, the ECB Governing Council raised it to 2.25% with effect from 17 June 2026, in the face of an energy shock that pushed euro area inflation back above target. At the meeting of 23 July 2026 rates were left unchanged: inflation had fallen to 2.8% in June from 3.2% in May, but — the ECB explained — the effects of the shock "have yet to fully materialise" and inflation should remain well above 2% until the first half of 2027.
The moral: the yields on all European bonds rose together, mainly for monetary policy reasons common to the euro area. The Italian risk premium, measured by the spread, widened to a limited extent — from 64 to 77 basis points — remaining at historically low levels.
The snapshot of 29 July 2026
This is how the curve of the main euro area issuers looked on the afternoon of 29 July 2026.
| Ten-year bond | Yield | Spread over the Bund |
|---|---|---|
| Germany (Bund) | 3.14% | — |
| Spain (Bonos) | 3.60% | 46 bps |
| Greece | 3.85% | 71 bps |
| France (OAT) | 3.93% | 79 bps |
| Italy (BTP) | 3.98% | 83 bps |
Yields rounded to the hundredth of a point: the spread shown is the closing figure recorded by the market, which on unrounded values does not exactly coincide with the difference between the two figures reported.
Two details deserve attention. The first: Greece, which has a higher debt-to-GDP ratio than Italy (146.1% against 137.1% at the end of 2025, Eurostat data), pays less than Italy. The level of debt, on its own, does not explain the risk premium: what counts is the trajectory, the credibility and the judgement of the agencies. The second: the gap between the BTP and the French OAT has almost closed. In the ECB monthly averages the Italian yield was lower than the French one for three consecutive months — December 2025, January and February 2026 — something that had not happened for years.
What makes the differential move
- Perceived credit risk. Not so much the level of debt as its direction: a high but falling debt, with a primary surplus, is priced better than a lower but worsening one.
- Domestic politics. Uncertainty about the survival of a government or about the budget law feeds through to the spread within a few sessions, often even before the public accounts actually change.
- The central bank. Bond purchases compress differentials; their withdrawal reopens them. Since 21 July 2022 the ECB has also had the Transmission Protection Instrument (TPI), an unlimited purchase tool that can be activated against "unwarranted and disorderly" market dynamics. It has never been activated up to July 2026: it acts above all as a deterrent.
- The global rate cycle. When yields rise everywhere, the most indebted countries tend to widen more; when they fall, the opposite happens.
- Market liquidity. In August or during a sudden shock, modest volumes are enough to move the differential by several basis points without anything having changed in the fundamentals.
- The rating agencies. An improvement in the rating signals lower risk and, when it crosses thresholds that matter for investment mandates — first and foremost the investment grade one — it widens the pool of buyers. For Italy, already investment grade with every agency, the effect works mainly through the perception of risk rather than through mandate constraints.
The numbers of history
The table below reports the monthly averages of ten-year yields calculated by the ECB (Maastricht convergence criterion) at the moments that marked recent history. Being period averages, the daily highs were higher.
| Period | 10-year BTP | 10-year Bund | Spread |
|---|---|---|---|
| March 2005 (among the lows of the euro era) | 3.84% | 3.70% | 14 bps |
| August 2008 (pre-Lehman) | 4.81% | 4.20% | 61 bps |
| November 2011 (debt crisis) | 7.06% | 1.87% | 519 bps |
| July 2012 ("whatever it takes") | 6.00% | 1.24% | 476 bps |
| November 2018 (clash over the budget) | 3.39% | 0.31% | 308 bps |
| May 2020 (Covid shock) | 1.76% | −0.52% | 228 bps |
| October 2022 (ECB tightening) | 4.53% | 2.19% | 235 bps |
| December 2024 | 3.32% | 2.18% | 114 bps |
| February 2026 (lowest since 2008) | 3.39% | 2.74% | 64 bps |
| June 2026 | 3.73% | 2.96% | 77 bps |
The overall picture is more telling than the individual peaks. Calculated on the ECB monthly averages, the annual averages of the spread were 281 basis points in 2011, 400 in 2012 (the worst year ever), 221 in 2018, 201 in 2022, 139 in 2024, 98 in 2025 and around 76 in the first half of 2026. The monthly low of February 2026, at 64 basis points, had not been seen since August 2008, that is since the month before the failure of Lehman Brothers.
Why the spread fell while debt was rising
This is the apparent paradox of the last three years. Italian public debt went from 2,967.0 billion euros at the end of 2024 to 3,095.9 billion at the end of 2025, and the debt-to-GDP ratio climbed back from 134.7% to 137.1%, reaching 138.9% in the first quarter of 2026 (Eurostat). Yet the risk premium has halved. There are mainly four reasons.
First: the deficit. Italian net borrowing fell from 8.1% of GDP in 2022 to 7.1% in 2023, to 3.4% in 2024 and to 3.1% in 2025. It is the variable that markets watch most closely, because it is the flow that feeds the stock.
Second: the ratings. Between April 2025 and January 2026 all the main agencies improved or confirmed with an upward revision their assessment of Italy. The most significant case is that of Moody's, which on 21 November 2025 upgraded Italy to Baa2: the first improvement in twenty-three years.
| Agency | Rating | Date |
|---|---|---|
| S&P Global Ratings | BBB+ | 11 April 2025 |
| Fitch Ratings | BBB+ | 19 September 2025 |
| Morningstar DBRS | A (low) | 17 October 2025 |
| Scope Ratings | BBB+ | 31 October 2025 |
| Moody's | Baa2 | 21 November 2025 |
The table reports the last rating action of 2025: in Scope's case it was a confirmation of the BBB+ with the outlook moved to positive, not an upgrade. In 2026 the ratings were all confirmed: S&P raised the outlook to positive on 30 January, Fitch reaffirmed the BBB+ on 13 March, Morningstar DBRS the A (low) on 17 April and S&P confirmed BBB+ with a positive outlook on 15 May.
Third: the structure of the debt. According to the Ministry of the Economy, at 30 June 2026 government securities outstanding amounted to 2,720.3 billion, with an average life of 6.95 years — much longer than the 5.76 years of 2000, even if slightly below the recent highs (7.11 years in 2021 and 7.00 years at the end of 2024). The longer the average life, the more slowly a rise in rates is transmitted to the public budget: it is a shock absorber. The average cost at issuance, meanwhile, has fallen from 3.41% in 2024 to 2.75% in 2025.
Fourth: the comparison. The spread is a relative number. According to many analysts, part of the decline in the Italian differential in 2025-2026 reflects not so much Italy as the deterioration of French public finances: it is a market reading, not a measured relationship. France's debt-to-GDP ratio rose from 112.6% in 2024 to 115.6% in 2025 and to 117.6% in the first quarter of 2026, while Germany's, though increasing, remains just above 63%.
Who buys Italian debt has changed
Perhaps the most surprising figure concerns the pool of buyers. According to the statistics of the Banca d'Italia published on 15 July 2026, between December 2024 and April 2026 the share of debt held by the Banca d'Italia itself fell from 642.1 to 545.4 billion (from 21.6% to 17.3% of the total), while non-residents went from 916.0 to 1,125.9 billion, that is from 30.9% to 35.7%.
| Holder (April 2026) | Billions of euros | Share |
|---|---|---|
| Non-resident investors | 1,125.9 | 35.7% |
| Resident banks | 639.6 | 20.3% |
| Banca d'Italia | 545.4 | 17.3% |
| Other residents (households and firms) | 461.4 | 14.6% |
| Other resident financial institutions | 382.2 | 12.1% |
In other words: the central bank has pulled back by almost one hundred billion and the international private market has bought two hundred billion more, while the spread was falling. It is the sharpest rebuttal of the thesis that the Italian differential is held up only by the ECB's purchases.
Italian savers have played their part too: at 30 June 2026 the securities designed for the retail public were worth some 189 billion in total — 112.6 billion of BTP Valore, 56.2 of BTP Italia and 20.6 of BTP Futura — equal to about 7% of the securities outstanding.
What it costs, in euros
In 2025 the Italian State spent 87.1 billion euros on interest on the debt, equal to 3.9% of GDP. In the same year the euro area average was 1.9%: Italy pays, proportionally, a little more than double. Related to the resident population at 1 January 2026 (58,942,828 people), interest expenditure is worth about 1,480 euros per head per year, and the stock of debt about 52,500 euros per head (Hub Finanza calculations on Eurostat and Istat data).
To grasp the order of magnitude of the impact of a shift in the spread: with 2,720 billion of securities outstanding and an average life of 6.95 years, every year the Treasury rolls over roughly one seventh of the stock, that is around 390 billion. One hundred basis points more of yield on that share are worth, very approximately, almost 4 billion of additional interest in the first year, which accumulates over the following years as other maturities are refinanced (Hub Finanza estimate on MEF data; the actual effect depends on the composition of issuance).
This is why the spread is not a topic for insiders: every extra billion of interest is a billion that does not fund healthcare, schools or tax cuts.
What it has to do with a household's savings
Government bonds are the benchmark rate for the entire national credit system. When sovereign yields rise, lending to households and firms also tends to become more expensive. According to ECB statistics on bank interest rates, the average cost of new mortgages to Italian households for house purchase moved from 3.31% in October 2025 to 3.50% in May 2026: the same upward movement observed on government yields over the same period.
There is then a direct effect on those who own BTPs. The price of a bond moves in the opposite direction to the yield, and all the more so the longer the maturity. As a rule of thumb, a bond with a financial duration of about seven years loses around 7% of its price if the yield rises by one percentage point, and gains it if the yield falls. Those who hold the bond to maturity receive in any case the nominal principal and the agreed coupons: the swing matters for those who have to or want to sell earlier. On 29 July 2026 the two-year BTP yielded 3.03% and the thirty-year one 4.73%: the same signature, completely different price risks.
Five mistakes to avoid
- Confusing the spread with the cost of the debt. The spread is the difference, not the yield. In 2020 the spread was around 200 basis points but the BTP yielded less than 2%: for the public budget it was a better situation than a spread of 80 with yields at 4%.
- Reading a daily change as a signal. Ten basis points on an August day usually tell of a thin market, not a change of scenario.
- Forgetting the denominator. If the spread falls because the Bund rises, it is no Italian merit; if it rises because the Bund falls in a flight to quality, it is not necessarily an Italian fault.
- Looking only at the ten-year maturity. The differential on the two-year reacts to expectations about the ECB, the one on the thirty-year to long-term risk: if they move in diverging ways, the signal is more informative than the single number.
- Thinking that high debt is enough to explain everything. In the first quarter of 2026 Greece, with almost five points more debt-to-GDP than Italy (143.5% against 138.9%), was paying a lower risk premium.
What to watch from here on
Three elements will tell whether the level reached in 2026 is structural or merely a favourable phase.
The first is the trajectory of the deficit. Italy has remained under an excessive deficit procedure, opened by the Council of the European Union on 26 July 2024 and accompanied by the corrective recommendation of 21 January 2025. Exiting it on a lasting basis is the condition that more than any other separates a BBB+ rating from an A rating.
The second is nominal growth. The debt-to-GDP ratio falls if GDP grows more than the average cost of the debt. In the first quarter of 2026 Italian GDP rose by 0.8% year on year in real terms (Eurostat): a pace that, with inflation coming down, leaves little margin.
The third is monetary policy. If the energy shock of 2026 were to force the ECB to tighten further, everybody's yields would rise — but historically, in those phases, the most indebted countries widen more. It is the acid test: only a rising rate cycle will say whether the Italian risk premium has really come down or whether it was merely the reflection of generous financial conditions.
Sources: European Central Bank, statistics on long-term interest rates for the convergence criterion (IRS series, monthly averages, July 2026 update) and bank interest rate statistics (MIR); Eurostat, "EMU convergence criterion series", general government accounts (gov_10a_main, gov_10dd_edpt1, updates of 22 April and 21 July 2026), quarterly debt (gov_10q_ggdebt), national accounts and demographic statistics; ECB, monetary policy statement of 23 July 2026 and press release on the Transmission Protection Instrument of 21 July 2022; Banca d'Italia, "Public finances: borrowing requirement and debt", 15 July 2026 (table 5, holders of the debt); Ministry of the Economy and Finance — Treasury Department, "Composition of government securities outstanding at 30 June 2026", "Weighted average life of government securities" and "Main interest rates"; European Commission, excessive deficit procedure — Italy factsheet; CNBC and Teleborsa for the quotations of 29 July 2026 (3.29 p.m.); press releases and archives of S&P Global Ratings, Fitch Ratings, Moody's, Morningstar DBRS and Scope Ratings for the rating decisions. The monthly and annual averages of the spread and the holders' shares are Hub Finanza calculations on the official series cited; public finance data are subject to revision.
Disclaimer: the information provided in this article is for purely informational and educational purposes and does not in any way constitute personalised financial advice. Past returns are not indicative of future ones. It is recommended to consult a qualified professional before taking any investment decision.