


Two prices, more than all the others, work as the thermostat of the world economy: oil and the dollar. The first sets how much it costs to move goods, produce plastics and fertilisers, heat a home; the second is the unit of measurement in which that cost is written, everywhere in the world. Together they decide much of inflation, and therefore the choices of central banks, and therefore the price of shares and bonds.
This guide explains the mechanisms, not the forecasts, and tests them against a year that has offered a rare stress test: the war in the Middle East that began on 28 February 2026 and the closure of the Strait of Hormuz pushed Brent from 71 to more than 138 dollars a barrel in a few weeks, driving crude and the dollar up together: something the textbooks do not predict.
Why oil weighs more than any other commodity
Crude oil is not a finished product, it is an input: it enters the cost of almost everything that is moved or transformed. A rise in its price spreads through two channels. The first is direct and fast — petrol, diesel, kerosene — and shows up in the price index within a few weeks. The second is indirect and slow: firms absorb the higher transport costs for a few months, then pass them on to their price lists. When those increases feed into wage renewals, we speak of second-round effects: the ones central banks fear most, because they outlive the fall in the barrel price.
The euro area data for June 2026 (Eurostat, released on 17 July 2026) capture the mechanism: headline inflation at 2.8% year on year, down from 3.2% in May, but with the energy component at +8.5% (it was +10.8% in May) against +0.7% for non-energy industrial goods and +1.5% for food. A single item was running three times faster than the general index, while services at 3.2% showed the slow part.
What moves the price of crude oil
- Demand: it grows with world GDP and contracts in recessions.
- Supply: the decisions of the producers gathered in OPEC+, the spare capacity that can be brought on stream in a few days, investment in new extraction, which matures over years.
- Inventories: the buffer between the two. Falling, they signal a deficit; building up, a surplus.
- Geopolitics: wars, sanctions and blockades of transit corridors take millions of barrels off the market overnight.
- The dollar: the currency of quotation, so the exchange rate changes the effective price for those who do not earn in dollars.
One ingredient explains why the swings are so violent: the rigidity of demand in the short term. Those who drive to work do so even if petrol goes up by 20%. If demand reacts little, equilibrium is restored almost entirely through the price: a shortfall of a few percentage points of supply can translate into rises of tens of points in the barrel price.
2026, a case study
The Strait of Hormuz is the bottleneck of the world energy system: before the conflict about one fifth of the oil and liquefied natural gas traded in the world passed through it, with about 130 transits a day. On 2 July 2026 confirmed transits were 38, less than a third of normal (Al Jazeera). Since then the situation has worsened: on 23 July the International Monetary Fund's PortWatch counted 10 against a baseline of 88, and between 22 and 24 July daily transits fell to three (Kpler); as of 29 July 2026 the Strait is once again closed to commercial traffic.
The daily quotations of the EIA's “Europe Brent Spot Price FOB” series tell the story of 2026 as follows (the latest figure available in the series is that of 27 July).
| Date | Brent (dollars/barrel) | Context |
|---|---|---|
| 27 February 2026 | 71.32 | Last quotation before the attack on Iran |
| 20 March 2026 | 118.42 | Hormuz closed, Gulf supply blocked |
| 7 April 2026 | 138.21 | Year's high, the highest since July 2008 |
| 17 April 2026 | 98.63 | Low of the April correction |
| 30 April 2026 | 124.24 | Second wave of increases at the end of the month |
| 2 July 2026 | 68.53 | Below pre-war levels after the US-Iran memorandum |
| 23 July 2026 | 105.32 | Houthi attacks on two Saudi tankers in the Red Sea |
| 27 July 2026 | 91.82 | Latest quotation available in the series |
In five months the barrel has crossed the band between 70 and more than 130 dollars several times, in both directions. It is not a market that “rises” or “falls”: it reprices risk with every piece of news. After the memorandum of understanding between the United States and Iran of mid-June 2026 — dated 17 June by Al Jazeera and 18 June by the EIA — the American agency revised the expected decline in world inventories in the third quarter of 2026 from more than 7 million barrels a day to 2.2 million.
2026 has also shown how theoretical OPEC+ quotas are when the logistics are missing: seven countries in the group approved consecutive monthly increases — the latest, on 6 July 2026, of 188,000 barrels a day from August — but the Saudi quota for June was 10.291 million barrels a day against actual output of 7.76 million in March. According to the International Energy Agency (10 July 2026) world supply rose again in June to 98.8 million barrels a day, with 117 million more barrels “on the water”: loaded but stuck at sea, and therefore not yet available supply. For 2026 the IEA estimates demand falling by about 1 million barrels a day, a rare event outside recessions.
The last few years in numbers
Annual averages separate the noise from the cycle. According to the U.S. Energy Information Administration, Brent averaged 41.96 dollars in 2020 (the pandemic collapse), 70.86 in 2021, 100.93 in 2022 after the Russian invasion of Ukraine, 82.49 in 2023, 80.52 in 2024 and 69.14 in 2025, the lowest value of the five-year period.
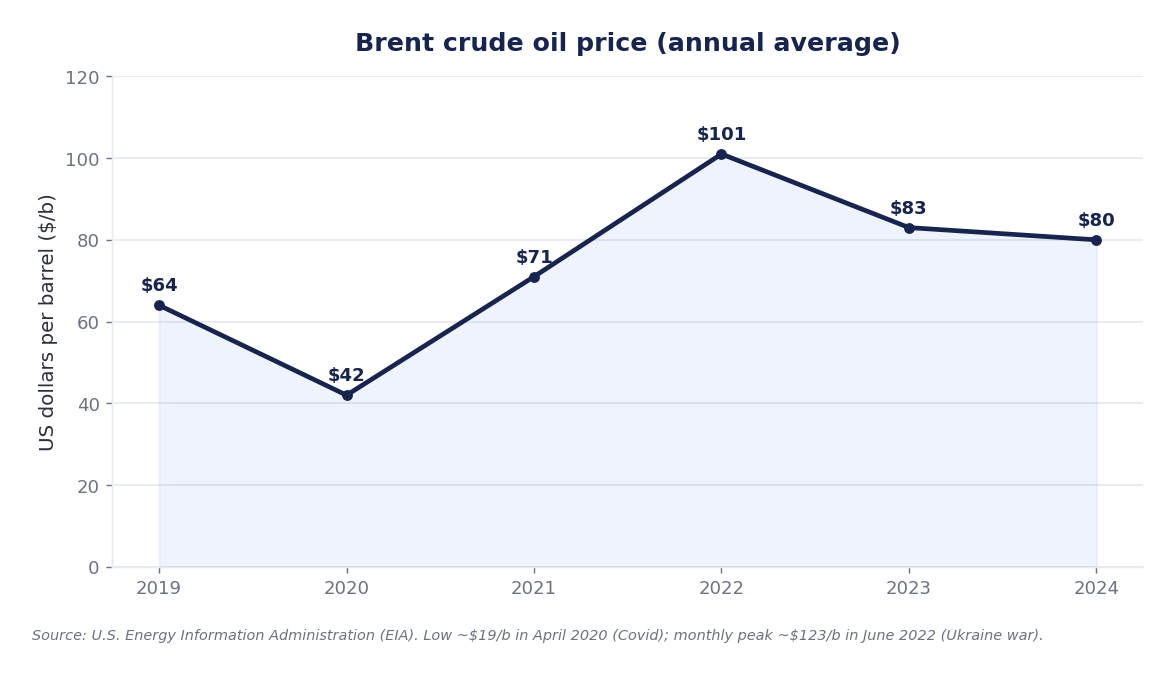
The EIA's Short-Term Energy Outlook of 7 July 2026 estimates an average of 82 dollars in 2026 and 65 in 2027: the second figure incorporates the assumption that, with transits resuming, the market returns to the oversupply that preceded the conflict. It is a forecast, not a fact.
Why the dollar is the other half of the price
Oil is quoted in dollars everywhere. But the dollar is not the reference currency because oil is bought with it: if anything, the opposite is true. Its centrality comes from the depth of American markets, from the liquidity of Treasury securities and from the inertia with which everyone uses the instrument that everyone else uses.
| Indicator | Dollar | Euro | Period and source |
|---|---|---|---|
| Presence in the foreign exchange market (out of 200%: every trade involves two currencies) | 89.2% | 28.9% | April 2025, BIS triennial survey |
| Share of world official foreign exchange reserves | about 57% | about 20% | fourth quarter 2025, ECB based on IMF data |
To give a sense of the scale: the foreign exchange market moved 9,600 billion dollars a day in April 2025, 28% more than in 2022; in reserves at the end of 2025 the renminbi remained close to 2%. Those who announce the end of the dollar should explain which currency is taking up those shares: for the moment, none. Some cracks are visible, though: in March 2026 Treasury securities held in custody at the New York Federal Reserve on behalf of official institutions fell to their lowest level since 2012.
The link between the two prices is no longer the textbook one
The classic rule says that oil and the dollar move in opposite directions, for two reasons. The first is arithmetic: if the dollar strengthens, the barrel costs more in all other currencies, demand cools and the price in dollars tends to fall. The second is historical: when the United States was a large net importer of crude, an expensive barrel worsened the trade balance and weakened the currency.
The second reason no longer applies: with shale production the United States has become a net energy exporter, and the sign of the relationship has been reversed. The European Central Bank explains this in its report on the international role of the euro of 2 June 2026: when the war broke out the United States, an energy exporter, suffered a positive terms-of-trade shock, while the euro area, a net importer, suffered a negative one; the generalised appreciation of the dollar is partly attributable precisely to the different degree of exposure of countries to the energy shock.
The figures for 29 July 2026 confirm it: with Brent close to 90 dollars, the dollar index (DXY) was at 101.10, up 1.29% over twelve months according to Trading Economics, and the euro was worth 1.1367 dollars on 28 July (ECB reference rate) against a 2026 high of 1.1974, reached on 28 January. The inverse correlation is a tendency, not a law.
What it means, in concrete terms, for those who live in euros
For an importing economy the double movement is a double blow. On 29 July 2026 a barrel of Brent cost 89.53 dollars, about 78.8 euros at the exchange rate of 1.1367. At the euro's high for the year (1.1974 dollars, on 28 January) the same barrel would have cost 74.8 euros: about 4 euros less, 5%. That difference does not depend on oil but on the exchange rate, and it is paid by those who buy in euros.
The consequences for monetary policy came quickly. On 11 June 2026 the ECB raised rates for the first time in three years, bringing, from 17 June, the rate on main refinancing operations to 2.40% and the deposit rate to 2.25%, justifying the move with energy prices; on 23 July it left rates unchanged. In the United States federal funds had been steady in the 3.50%-3.75% range since 11 December 2025, but on the eve of the 29 July 2026 meeting the markets were pricing in, according to Trading Economics, about a one-third probability of a rise: it is oil that has changed the conversation.
How it reaches the portfolio
On equities an expensive barrel favours oil and gas producers and squeezes the margins of air transport, chemicals, cement and steel. On bonds it feeds expected inflation, which raises nominal yields and pushes down the price of securities already issued: the ECB's rate rise of June 2026 is the visible transmission link. On currencies it strengthens the currencies of energy exporters and weakens those of importers, with emerging markets suffering both more expensive energy and more costly dollar debt. At the pump the effect is dampened and delayed: between crude and the filling station there are refining, logistics, margins, the exchange rate and above all excise duties and VAT.
What to watch
- Transits through Hormuz: the ratio between actual transits and the roughly 130 before the conflict is the most direct thermometer of supply risk.
- Inventories and oil “on the water” in the IEA reports and in the EIA's Short-Term Energy Outlook: if they build up, they anticipate a fall in prices.
- The gap between OPEC+ quotas and actual output: it measures the cartel's real room for manoeuvre.
- The energy component of inflation (Eurostat, ISTAT) and the euro/dollar exchange rate published every day by the ECB: they measure how much of the barrel has already reached consumer prices.
Oil dictates the cost of energy, the dollar serves as the unit of measurement of world trade. Understanding why they sometimes move together is worth more than any forecast on the barrel six months from now.
Sources: U.S. Energy Information Administration, “Europe Brent Spot Price FOB” series and “Short-Term Energy Outlook” (7 July 2026); International Energy Agency, “Oil Market Report” (10 July 2026); European Central Bank, “The international role of the euro” (2 June 2026), official rates and reference exchange rates (28 July 2026); Bank for International Settlements, triennial survey of foreign exchange markets (April 2025); Eurostat, euro area inflation for June 2026; Federal Reserve, “Open Market Operations”; Al Jazeera (3 May, 6 and 8 July 2026) for the conflict, Hormuz transits and OPEC+; IMF PortWatch and Kpler for transits at the end of July 2026; CNBC and The National (23 July 2026) for the attacks on tankers in the Red Sea; Fortune and Trading Economics (April-July 2026) for Brent, the dollar index and rate expectations. Intraday quotations may differ between sources and observation times.
Disclaimer: the information provided in this article is for purely informational and educational purposes and does not in any way constitute personalised financial advice. We recommend consulting a qualified professional before making any investment decision.