

On July 14, 2026, IBM announced that second-quarter revenue had grown by 1% and adjusted earnings per share by 5%. Two increasing numbers, no losses. That day the stock closed at 217.07 dollars, 25.21% down: the worst session in the company's history, more severe than October 19, 1987, Black Monday, when IBM lost 23.7%. Approximately 67 billion dollars of market capitalization evaporated in one day.
It's the paradox that earnings season re-proposes every three months: growing accounts, falling stock. It's not market irrationality; it's the arithmetic of expectations. Let's use the real numbers from that quarter, published in full on July 22, 2026, to explain how to read a financial statement, item by item.
First step: revenue, and especially where it comes from
Revenue measures how much the company has sold. IBM closed the second quarter of 2026, ended June 30, with 17.162 billion dollars, 1% more than the same quarter of 2025 (IBM publishes constant currency data only by segment, not for the total). The total, however, says little: the substance lies in the breakdown by segment.
| Segment | Revenue Q2 2026 | Y/Y Var. |
|---|---|---|
| Software | 7.8 billion $ | +5% |
| Consulting | 5.3 billion $ | unchanged |
| Infrastructure | 3.8 billion $ | −7% |
| Financing | 0.2 billion $ | +12% |
| Total | 17.162 billion $ | +1% |
One level below, enormous fluctuations are found (constant currency data):
| Product line | Y/Y Var. |
|---|---|
| IBM Z (mainframe) | −42% |
| Distributed Infrastructure | +37% |
| Data (software) | +18% |
| Hybrid Cloud (Red Hat) | +11% |
| Transaction Processing | −9% |
The 42% collapse in mainframes is not a bolt from the blue: it's a product cycle. IBM announced the z17 generation on April 8, 2025, available from June 18, 2025; customers concentrate purchases immediately after launch — in 2025, IBM Z revenue grew by 48%, the best year in about twenty years — and then stop. A year later, the comparison is against an inflated base.
Operational lesson: a turnover growing by 1% can hide a business accelerating by 37% and another contracting by 42%.
Second step: margins, or what remains of what is sold
The gross margin is the share of revenue that survives direct production costs. IBM recorded a gross profit of 9.907 billion dollars, equal to a margin of 57.7% according to mandatory accounting principles, down 100 basis points year-over-year; in the company's adjusted version, it was 59.4%, down 70 basis points. Pre-tax profit was 2.5 billion in the accounting version (margin of 14.4%) and 3.3 billion in the adjusted one (margin of 19.2%): different numerators, which is why the two margins are not derived from each other.
A declining margin while revenue rises signals that growth is costing more: a less favorable mix, pressured prices, or increasing costs. IBM attributed the contraction to the revenue gap and the mix — fewer mainframes, which yield a lot, and more distributed hardware, which yields less — only partially offset by productivity actions.
Third step: profit and EPS, between GAAP and non-GAAP
Net profit is what remains after all costs, financial charges, and taxes: for IBM, 2.165 billion dollars. EPS (earnings per share) divides that result by the number of shares, 953.3 million diluted weighted average in the quarter: it's the most closely followed figure because it measures profit per single share. Here appears the most confusing distinction:
- GAAP EPS: calculated according to mandatory U.S. accounting principles, including everything — amortization of intangibles from acquisitions, restructuring charges, extraordinary items. For IBM: 2.27 dollars, 2% less year-over-year.
- Adjusted EPS (non-GAAP): the version calculated by the company excluding items it deems not representative of ordinary operations. For IBM: 2.93 dollars, 5% more year-over-year.
The difference between the two, 66 cents, is not a detail. Non-GAAP helps compare quarters by removing noise, but it's a measure chosen by the company: when the distance is wide or grows over time, it's advisable to read the reconciliation attached to the press release. For the semester: 3.55 accounting dollars versus 4.84 adjusted.
And here's the central point: adjusted earnings per share grew by 5%. Industrially, it was not a disaster; yet the stock lost a quarter of its value.
Fourth step: consensus and earnings surprise
The explanation lies in a number not appearing in the financial statements: the consensus, the average of estimates that analysts publish before the results, collected by providers like LSEG or FactSet. A stock's price already incorporates those estimates. What moves it, therefore, is not the absolute result but the earnings surprise: the deviation between what arrives and what was already in the price.
| Item | Consensus | Actual | Deviation |
|---|---|---|---|
| Revenue | 17.86 billion $ | 17.162 billion $ | −0.70 billion $ (−3.9%) |
| Adjusted EPS | approx. 3.02 $ | 2.93 $ | −0.09 $ (−2.9%) |
Both estimates are those circulating before the July 14 announcement: 17.86 billion in revenue and adjusted earnings per share between 3.01 and 3.02 dollars (LSEG and FactSet surveys). However, consensus is not a fixed number: immediately after the announcement, analysts cut the EPS estimate to 2.97 dollars, which is what CNBC cited on July 22. Comparing the result with the consensus after the pre-announcement makes the deviation seem much smaller than what the market actually had to digest: when reading an earnings surprise, the date the estimate was taken matters as much as the estimate itself.
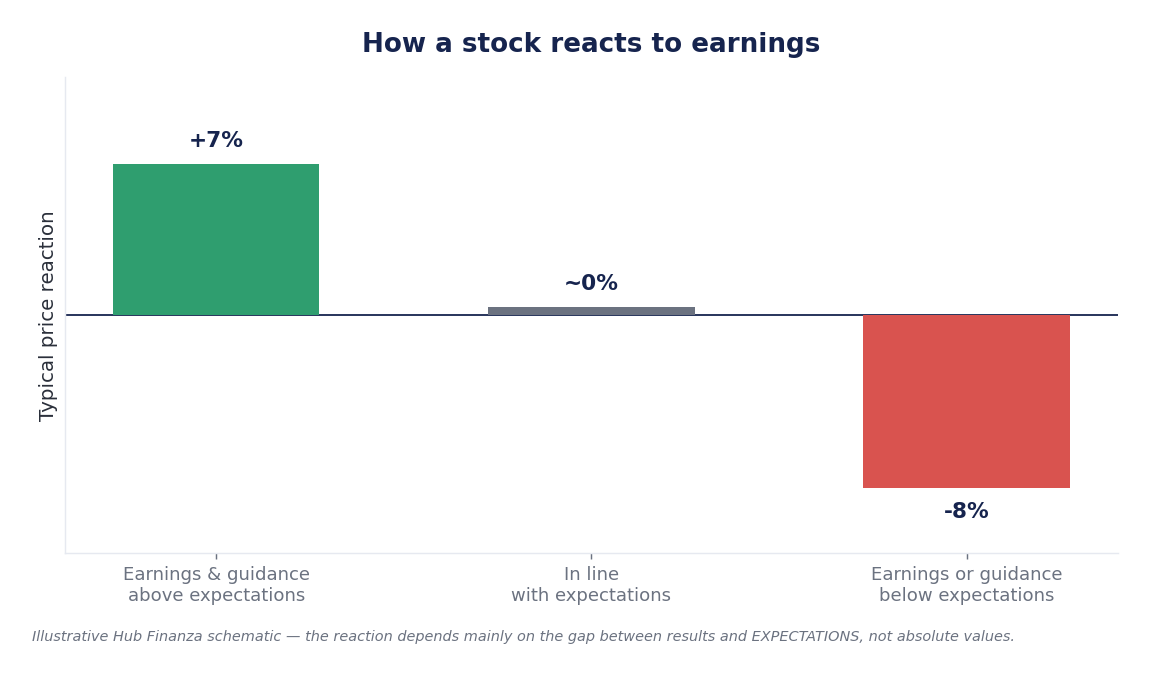
Be careful with the order of magnitude, however: missed revenue of 3.9% and missed EPS of 2.9% do not alone justify a 25% drop. A third element is needed.
Fifth step: free cash flow
Free cash flow is the cash remaining after investments necessary to run the business: it's what funds dividends, share buybacks, and debt repayment, and it's less malleable than profit with respect to accounting choices.
IBM generated 2.5 billion dollars in the quarter, 0.3 billion less year-over-year, against 2.6 billion in operating cash flow; in the first half of 2026, free cash flow was 4.8 billion, unchanged. At the end of June 2026, the balance sheet showed 7.2 billion in cash, 62.0 billion in total debt (of which 13.0 related to customer financing), and 34.5 billion in net equity; in the quarter, 1.6 billion in dividends were distributed, with a coupon of 1.69 dollars per share payable on September 10, 2026.
Sixth step: guidance, the most impactful item
Guidance is the forecast that the company provides for the current year. It is not a legal obligation, but it is the channel through which management tells the market where it expects to go. And this is where the most delicate part of the whole story lies, because IBM's two announcements traveled separately. On July 14, the company only released preliminary numbers and left the annual target without comment, deferring: "We will hold our regularly scheduled conference call on July 22, 2026, at 5:00 PM ET to go into detail and discuss full-year expectations." The cut came eight days later, on July 22, along with the full accounts: 2026 revenue growth at constant currencies decreased from above 5% to 4-5%, while the free cash flow forecast was confirmed, about 1 billion dollars more than 2025.
One percentage point less seems minor. It is not. The first reason is mechanical: equity valuations discount future flows, and lowering the growth rate for one year shifts the entire trajectory for subsequent years downwards. The second is credibility: a company forced to pre-announce its numbers with an out-of-schedule communication, and eight days later revises its annual forecast downwards in the regular call, admits a lower visibility into its affairs than the market attributed to it. "This quarter we faltered. We did not adapt or move quickly enough," wrote CEO Arvind Krishna on July 14, 2026.
Why the stock collapses when earnings grow
A stock's price reflects expectations for future earnings, and a quarterly report shifts it only to the extent that it changes those expectations. In IBM's case:
- revenue and adjusted profit growth: compared to the past, no disaster;
- revenue below consensus by 3.9%: quarterly expectations were too high;
- no confirmation of the annual target: on July 14, IBM did not touch it, and the market had to price in the cut that would arrive on the 22nd itself;
- an explanation that does not reassure: IBM attributed most of the gap to large contracts not closed on time and to clients who, in the last weeks of June, diverted their budget towards servers, storage, and memory. Management framed it as a timing issue; the market read it as a trajectory issue.
The 25.21% decline did not price in the just-closed quarter. It re-priced all those to come.
The acid test: on the day of the real accounts, the stock moved 0.4%
The sequence of sessions offers an elegant verification of the thesis, provided it is read with a clock in hand. IBM pre-announced preliminaries on July 14, 2026, and published the full financial statements on July 22 at 4:08 PM ET, i.e., after the market had already closed: the session on the 22nd took place before the release and cannot be its reaction. The first viable session to price the accounts is July 23. If prices were moved by the numbers themselves, that would have been the decisive day. The opposite happened.
| Date (2026) | Close | Change |
|---|---|---|
| July 10 | 287.56 $ | −2.62% |
| July 14 — preliminaries | 217.07 $ | −25.21% |
| July 17 | 212.67 $ | −2.91% |
| July 22 — full financial report after close | 205.77 $ | −2.25% |
| July 23 — first session on the accounts | 206.65 $ | +0.43% |
| July 28 | 227.55 $ | +5.21% |
On July 23, the first session after the official publication, the stock gained 0.43%. And not because the press release was a photocopy of the pre-announcement: it contained new and unpleasant news, the cut of the annual target to 4-5%. The market had already priced it in eight days earlier, when IBM missed revenue and refrained from confirming the year: the 25.21% collapse also included the hypothesis of the cut, which then arrived punctually. This is why "the market discounts" is not just a saying: the price moves on new information, not on the accounting document — and when the document arrives, the news it contains is often already old.
In the following days, analysts rewrote their estimates: between July 23 and 24, 2026, Susquehanna cut its price target from 303 to 225 dollars, Citi from 255 to 245. As of July 24, the consensus of 25 analysts remained a "buy," with an average target of 244.16 dollars and a range between 174 and 350: how much disagreement a single quarter can leave behind.
When profits are truly record-breaking: SK hynix
The paradox also works in its extreme form. On July 29, 2026, Korean SK hynix published the best quarter in its history — operating profit at 60,542.6 billion won, +557% year-over-year, margin of 76% — and the stock closed in Seoul at −9.61%: the LSEG SmartEstimate consensus indicated approximately 64,000 billion, the result came in 5.5% below. Record profits, but not record enough. With a methodological caveat: that day, the entire Korean market was down about 6% after an 11% drop on the eve, overwhelmed by the forced liquidation of leveraged positions. The negative surprise played a role, but not by itself: before attributing a movement to a quarterly report, it's always worth looking at what the surrounding market was doing.
What to watch now
For IBM, three elements will tell whether July 2026 was a valuation correction or a change in trajectory. The mainframe cycle: if the 42% drop in IBM Z is a timing issue, the year-over-year comparison will turn favorable with the next generation; if it reflects clients permanently shifting their budget elsewhere, the problem is different. The stability of the new guidance: after a downward revision, the market gives little credit to a second one. And free cash flow, the only annual commitment that was not adjusted on July 22.
The rule applies to any company: a quarterly report is not read to know how things went, but to understand what changes from now on. The past is already priced in.
Sources: IBM, «IBM Releases Second-Quarter Results» (22/07/2026) for revenue, margins, profit, EPS, cash flow, balance sheet, dividend, and guidance; IBM, «Arvind Krishna's Letter to IBM Investors» (14/07/2026) for preliminaries and the cited statement; StockAnalysis.com (data as of 28/07/2026) for stock closes, quarterly income statement, and price targets; CNBC and Forbes (14-15/07/2026) for pre-announcement consensus, wiped-out capitalization, and the previous record of October 19, 1987; Reuters, «South Korea stock rout breaks records as SK Hynix earnings disappoint» (29/07/2026) for the context of the Korean market; SK hynix, «2Q26 Financial Results» (29/07/2026). Company data follows the accounting principles of the respective companies and is subject to revision.
Disclaimer: the information provided in this article is for informational and educational purposes only and does not constitute personalized financial advice. The corporate cases cited are didactic examples, not investment recommendations. It is recommended to consult a qualified professional before making any investment decisions.