



Albert Einstein is credited with defining compound interest as «the eighth wonder of the world». There is no documentary proof that he ever uttered it, but the phrase has survived because it describes a real mechanism: growth that feeds on itself and which, after a certain number of years, ceases to resemble a straight line.
It is worth starting with the flip side of the coin, because in Italy it is the most visible part. As of 30 April 2026, Italian families held 1.163 billion euros idle in current accounts: a stock almost stagnant in nominal terms compared to April 2022 (−0.4%) but which in four years lost 11.6% of its purchasing power. Someone who had 1.000 euros in their account in April 2022 could buy the equivalent of about 884 four years later: across the entire aggregate, approximately 135 billion evaporated without anyone selling anything at a loss. That too is compound capitalization: it was working for inflation.
What distinguishes compound from simple interest
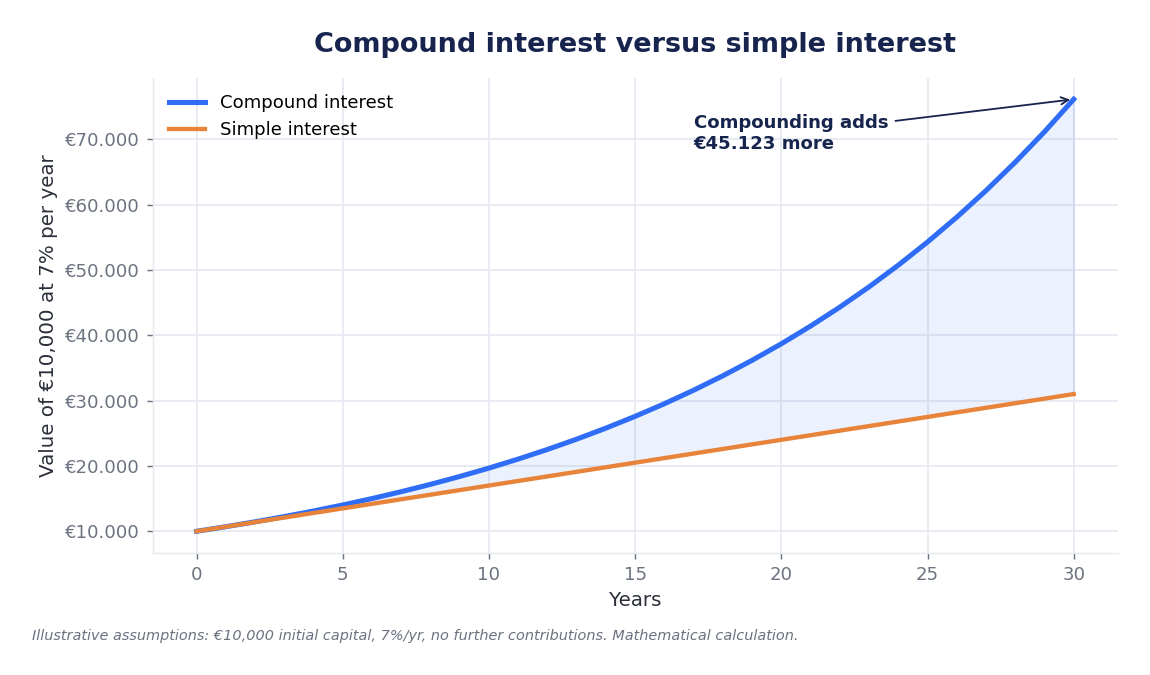
With simple interest, the return is always calculated only on the initial principal: 10.000 euros at 6% yield 600 euros the first year, 600 the second, 600 the thirtieth.
With compound interest, the accrued interest is added to the principal and in turn generates interest: the total amount is the principal multiplied by (1 + rate) raised to the power of the number of years. Not a straight line, but an accelerating curve.
The table compares the two mechanisms on 10.000 euros with a hypothetical annual return of 6%: it is not a forecast, it only serves to make the mechanism clear. As an order of magnitude, from 1926 to June 2026, US equities yielded an annual 10.47% compound return in nominal terms and 7.28% net of inflation (S&P 500, dividends reinvested).
| Years | Simple interest | Compound interest | Difference |
|---|---|---|---|
| 5 | 13.000 € | 13.382 € | +382 € |
| 10 | 16.000 € | 17.908 € | +1.908 € |
| 20 | 22.000 € | 32.071 € | +10.071 € |
| 30 | 28.000 € | 57.435 € | +29.435 € |
| 40 | 34.000 € | 102.857 € | +68.857 € |
The figure to look at is not the final total but the pace at which the difference forms. In the first five years, the compound advantage is 382 euros: irrelevant. Between the twentieth and fortieth year, it increases from 10.071 to 68.857 euros. Almost all the benefit comes in the last third of the journey — which is the segment most people never reach, because they stop earlier.
The rule of 72, and how precise it really is
To estimate mentally how many years it takes for capital to double, divide 72 by the annual rate in percentage points: at 6% it takes 12 years, at 3% twenty-four, at 12% six. It is an approximation, and it is worth knowing how close it is: the exact calculation is ln 2 / ln(1 + r).
| Annual rate | Rule of 72 | Exact value | Error |
|---|---|---|---|
| 2% | 36.0 years | 35.00 years | +1.00 |
| 3% | 24.0 years | 23.45 years | +0.55 |
| 4% | 18.0 years | 17.67 years | +0.33 |
| 6% | 12.0 years | 11.90 years | +0.10 |
| 8% | 9.0 years | 9.01 years | −0.01 |
| 10% | 7.2 years | 7.27 years | −0.07 |
| 12% | 6.0 years | 6.12 years | −0.12 |
The rule is more precise between 6% and 10%, where the error remains under a tenth of a year, and loses accuracy at very low rates. Its value, however, is not precision: it is to show that small differences in return produce huge differences in time. Between 3% and 6% there are three percentage points; between their respective doubling times, twelve years. Read in reverse, it also applies to inflation: at a stable 3%, purchasing power halves in about 23 years, and in June 2026, Italian inflation was +3.0% according to Istat.
Time weighs more than the amount
This is the most useful corollary. Let's simulate constant monthly contributions until age 65, again with the didactic hypothesis of 6% annual interest compounded monthly.
| Who starts | Contribution | Years | Total contributed | Final capital |
|---|---|---|---|---|
| at 25 years | 200 €/month | 40 | 96.000 € | 398.298 € |
| at 35 years | 200 €/month | 30 | 72.000 € | 200.903 € |
| at 45 years | 200 €/month | 20 | 48.000 € | 92.408 € |
| at 35 years | 400 €/month | 30 | 144.000 € | 401.806 € |
The first two rows say that a ten-year delay does not cost a quarter of the result: it costs half. The last is even more eloquent: to match someone who started at 25 with 200 euros per month, someone starting at 35 must double the contribution and put in an additional 48.000 euros out of their own pocket. The missing ten years cannot be bought.
Compound interest working against you, first: inflation
A nominal return says nothing until it is compared with the cost of living. And the real return is not the simple difference between the two numbers: it is obtained with (1 + return) / (1 + inflation) − 1, so that a 6% nominal return with 3% inflation is worth 2.91%, not a round 3%.
Over thirty years, the gap becomes evident: 10.000 euros at 6% reach 57.435 nominal euros, but with constant 3% inflation, that capital would buy the equivalent of 23.662 euros from 2026. Increased by 5.7 times on paper, by 2.4 in reality. Here are the gross returns available in Italy in summer 2026.
| Instrument / reference | Value | Date |
|---|---|---|
| Italy inflation (NIC, trend) | +3.0% | June 2026 |
| Italy core inflation | +1.6% | June 2026 |
| Euro area inflation (HICP) | +2.8% | June 2026 |
| Average rate on current accounts (ABI) | 0.31% | June 2026 |
| Average rate on total deposits (ABI) | 0.67% | June 2026 |
| New fixed-term deposits (ABI) | 2.31% | June 2026 |
| BCE deposit rate | 2.25% | 23 July 2026 |
| 10-year BTP (yield) | 3.95% | 29 July 2026 |
The decisive row is the fourth. With a current account at 0.31% gross and inflation at 3.0%, 10.000 euros left idle for ten years become 10.314 nominal euros but are worth the equivalent of 7.675 euros in 2026 purchasing power: approximately a quarter less. This is not a hypothetical risk; it is arithmetic — the same mechanism as the 1.163 billion we started with.
As for the context, on 23 July 2026, the BCE left interest rates unchanged (deposits 2.25%, main refinancing 2.40%, marginal lending 2.65%), while Eurosystem staff projections from June 2026 indicate euro area inflation at 3.0% in 2026, 2.3% in 2027, and 2.0% in 2028. Even in the return scenario, inflation continues to compound.
Compound interest working against you, second: costs
An annual fee seems small because it is expressed over one year, but it must be compared with the return and then compounded like everything else: 1.8% in costs on a gross return of 6% is not «1.8%», it is almost a third of the return, every year. On 100.000 euros invested for thirty years at 6% gross:
| Annual cost | Net return | Capital after 30 years |
|---|---|---|
| 0.20% | 5.80% | 542.713 € |
| 1.00% | 5.00% | 432.194 € |
| 1.80% | 4.20% | 343.583 € |
| 2.20% | 3.80% | 306.140 € |
Between the first and third rows there is 199.130 euros: almost double the initial capital, gone in fees and in lost interest on fees. Costs are the only variable of an investment that is known with certainty in advance, and therefore the only one that can truly be decided upon.
The direction, at least, is the right one: in the Esma report on the costs of EU retail investment products of 3 March 2026, the ongoing costs of EU retail equity funds (excluding ETFs) fell by 8% between 2020 and 2024 and those of bond funds by almost 15% between 2021 and 2024; for ETFs, the drop was 13% for equity (2020-2024) and 17% for bond (2021-2024). These are cumulative declines over several years, not annual reductions. However, it is a reduction driven by newly established funds: for existing ones, it only reaches 3% and 9%.
Compound interest working against you, third: taxes
In Italy, financial income is taxed at 26% — interest from current accounts and deposit accounts, capital gains and proceeds from shares, corporate bonds, funds, SICAVs, ETFs — with the exception of Italian and equivalent government bonds, at 12.5%. An annual stamp duty of 0.20% on the value of financial products held is also added.
The lesser-known point is that when you pay also matters. If the 6% gross is taxed every year, the return that compounds drops to 4.44% and 10.000 euros after thirty years become 36.813 euros. If the tax is paid only once upon realization, the gross amount of 57.435 euros leaves 45.102 euros net. The difference, 8.289 euros, does not depend on the rate — which is identical — but on the fact that in the second case, the portion intended for the tax authorities also worked until the end.
How to get on the right side of the curve
The most ordinary way to make capitalization work is to contribute constant sums at fixed intervals — the classic accumulation plan — and reinvest what is received: it automates the variable that matters most, the number of years. The Italian container is large (according to Assogestioni, at the end of March 2026, assets under management were worth 2.582 billion), but the selection within it — costs, horizon, taxation — determines which row of the tables above one ends up inhabiting.
Three caveats. Constant rate simulations isolate the mechanism; they do not describe markets, where returns are irregular and include negative years. Compound interest does not reward initial capital more than time, if anything the reverse: the exponent weighs more than the base. And disinvesting to re-enter later does not pause the curve, it erases the final years, those in which growth is steepest.
What to watch in the coming months
Three variables will determine how much compound interest works for or against Italian savers in the rest of 2026.
The first is the inflation path: carry-over inflation for 2026 settled at +2.6% for the general index and 1.7% for the core component, which in June 2026 (+1.6%) remains well below the general index. The difference is almost all energy.
The second is monetary policy: after the pause on 23 July 2026, every BCE move is transmitted with a delay to bank rates, and the gap between the 0.31% on current accounts and the 2.31% on new fixed-term deposits in June 2026 measures how much it is worth moving liquidity to where it yields.
The third is the cost of the portfolio: the only one that does not depend on markets or central banks, and the one on which — as the 199.130 euros in the table show — the largest share of the long-term result is played out.
Sources: Istat, «Consumer prices — final data, June 2026» (16/07/2026); Eurostat (17/07/2026) for the euro area; BCE, «Monetary policy decisions» (23/07/2026) and Eurosystem staff projections (June 2026); ABI, «Monthly Outlook» July 2026 (data as of June 2026) for current account and deposit rates; Banca d'Italia, database «Deposits by province, sector and sub-sector of clientele» as of 30/04/2026, Ref Ricerche elaboration taken from Il Sole 24 Ore (July 2026); Ansa and QuiFinanza (29/07/2026) for the 10-year BTP; Esma, «Costs and Performance of EU Retail Investment Products» (03/03/2026, 2024 data); Assogestioni, «Quarterly map of managed savings — 1st quarter 2026»; Officialdata.org on S&P 500 series with dividends reinvested, 1926 — June 2026. Constant rate simulations are Hub Finanza elaborations for illustrative purposes: they do not represent expected or promised returns.
Disclaimer: the information provided in this article is for informational and educational purposes only and does not constitute personalized financial advice in any way. It is recommended to consult a qualified professional before making any investment decisions.