



On 28 July 2026 anyone holding an ETF on the MSCI World index was little more than 2% away from the high of the last 52 weeks, with a twelve-month return of 17.87% including dividends. Anyone who over the same months had bet on Microsoft — the third-largest stock by weight in the S&P 500 — found themselves 29% below the stock's high. Same market, same twelve months.
That gap is called diversification: finance's oldest piece of advice and the only risk-management principle that economic theory has proved with mathematics. It works under precise conditions, though, and in 2026 those conditions are less obvious than expected — the global index many people use to diversify is the most concentrated in decades.
Two kinds of risk: the one that disappears and the one that stays
Equity risk breaks down into two parts, and the distinction underpins everything else.
- Specific risk (or diversifiable risk): it concerns the individual company — disappointing accounts, a lawsuit, a plant at a standstill. It is removable: it strikes one company at a time, and with many companies in the portfolio one firm's mishap is diluted by the others.
- Systematic risk (or market risk): it concerns everyone together — recessions, rate rises, energy shocks, inflation. It is not eliminated by adding stocks, and it is the risk for which the market pays a premium: the entry price for anyone who wants to earn more than cash.
Hence the definition of diversification as finance's only free lunch: a portfolio's expected return is the weighted average of the expected returns of its components, while overall risk — if those components do not move in unison — is lower than the average of their risks.
How many stocks are really needed
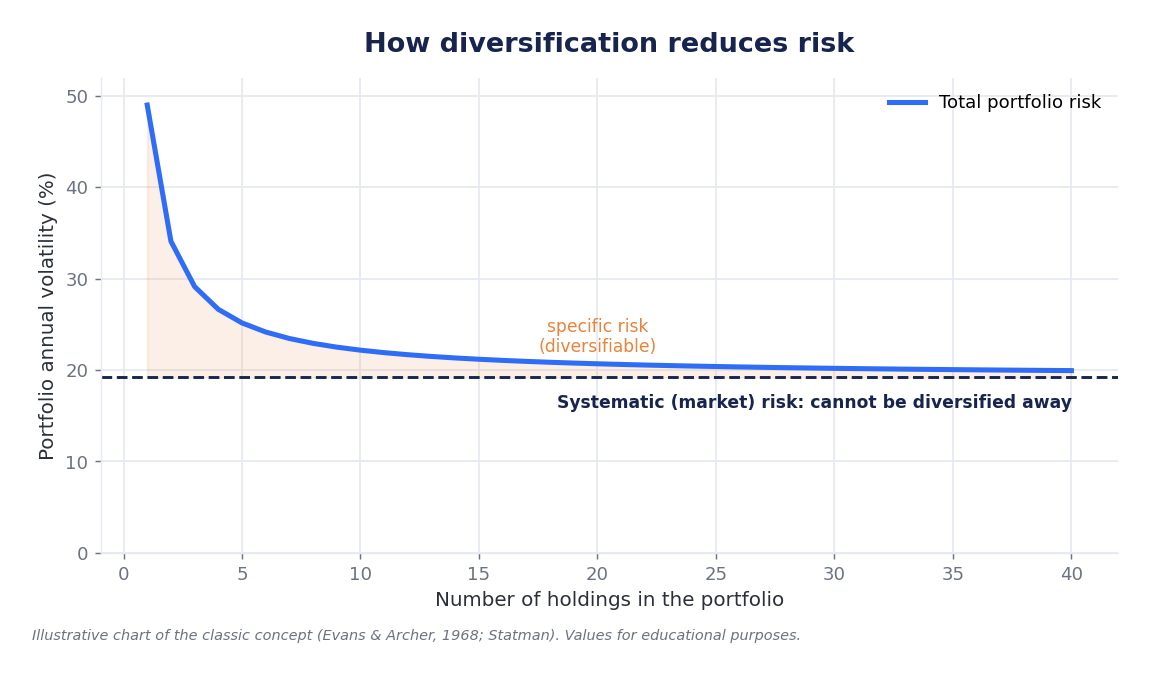
The classic study by Evans and Archer (1968) built portfolios of randomly drawn shares, measuring variability as the number of holdings grew: the bulk of the benefit arrived within the first 8-10 stocks and was exhausted at around 10-15.
Almost twenty years later Meir Statman, in “How Many Stocks Make a Diversified Portfolio?” (Journal of Financial and Quantitative Analysis, vol. 22 no. 3, 1987, pp. 353-363), overturned that finding by taking into account the opportunity cost relative to a risk-free asset: at least 30 stocks are needed for an investor who borrows and 40 for one who lends. Later reviews point to 30-50 stocks, some to more than a hundred, because the dispersion of individual stock returns has grown since the 1960s.
The practical point does not change, however: the risk curve falls steeply and then flattens out. From 1 to 10 stocks the gain is enormous, from 40 to 60 it is marginal. And no number of shares will ever take the curve below the market-risk line.
The engine is not the headcount: it is correlation
A portfolio of forty Italian banks is not diversified, however many names it holds. What decides the matter is not the number but correlation: how far two investments move in the same direction, on a scale from +1 to −1. It is the insight of Harry Markowitz in “Portfolio Selection” (The Journal of Finance, March 1952), the work that earned him the Nobel prize in economics in 1990 together with Merton Miller and William Sharpe.
Two investments with the same volatility, 20% a year, combined half and half:
| Correlation between the two | Volatility of the 50/50 portfolio | Risk versus the single investment |
|---|---|---|
| +1 (they move identically) | 20.0% | unchanged |
| +0.5 | 17.3% | −13% |
| 0 (independent) | 14.1% | −29% |
| −0.5 (half opposite) | 10.0% | −50% |
The example is illustrative — the values come out of the portfolio variance formula — but the message is correct: two assets with identical risk produce opposite outcomes depending on how alike their movements are. That is why putting five global equity funds side by side diversifies almost nothing, whereas combining weakly correlated asset classes moves the needle.
The evidence: the twelve months to the end of July 2026
Twelve-month return (dividends included) and distance from the 52-week high, closing prices of 28-29 July 2026.
| Instrument | 12-month return | Distance from the 52-week high |
|---|---|---|
| MSCI World ETF (URTH) | +17.87% | −2.2% |
| Equal-weighted S&P 500 (RSP) | +17.88% | −0.2% |
| Cap-weighted S&P 500 (SPY) | +17.57% | −2.6% |
| Gold (GLD) | +20.16% | −27.5% |
| US aggregate bonds (AGG) | +3.47% | −3.5% |
| NVIDIA (single stock) | n/a | −16.7% |
| Microsoft (single stock) | n/a | −29.2% |
The diversified baskets returned almost the same thing, between 17.5% and 17.9%, staying less than 3% from their highs; two of the most highly capitalised companies on the planet, by contrast, were 16.7% and 29.2% below their own. Gold returned more than global equities (+20.16%) even while sitting 27.5% below its high. Diversification does not eliminate the volatility of the individual bricks: it reduces that of the wall.
Diversifying across several dimensions
- By asset class. It is the dimension that weighs most: in the twelve months to 28 July 2026 global equities returned 17.87%, US bonds 3.47%.
- Geographic. It serves to avoid tying capital to the economy in which one already works and owns a home. Overweighting one's own country is called home bias.
- Sector. Anyone who held only technology in 2000, only banks in 2008 or only energy in 2020 knows how much a sector's cycle costs.
To these is added the time dimension: spreading out entry points does not raise the expected return, but it avoids making the whole investment coincide with an unlucky point in the cycle. A single instrument can then cover much of the rest: as at 30 June 2026 the MSCI World contained 1,283 stocks from 23 developed markets, about 85% of the free float of each country; the MSCI ACWI IMI, with 8,216 stocks as at May 2026 from 23 developed and 24 emerging markets, covers about 99% of the world's investable equity market.
The 2026 paradox: the global index is as concentrated as never before
Buying the index, however, is not the same as being automatically diversified: cap-weighted indices reflect the market, and the market in 2026 is heavily lopsided. As at 30 June 2026 the United States accounted for 72.45% of the MSCI World, ahead of Japan (5.69%), the United Kingdom (3.45%), Canada (3.34%) and France (2.40%): all the other developed countries, Italy included, shared the remaining 12.67%. Technology was worth 30.27% of the index, ahead of financials (15.88%) and industrials (11.64%). A “global equity ETF” is therefore three quarters an investment in the United States and almost one third an investment in technology.
In the US market, concentration in individual stocks is even more marked. According to J.P. Morgan Asset Management, in May 2026 the top ten companies in the S&P 500 accounted for 40.8% of the index against the 26.6% at the peak of the 2000 technology bubble; RBC Wealth Management put the figure at almost 41% at the end of 2025, against 18-23% over the 1990-2015 period. Those ten companies generated a little more than a third of the index's earnings and traded at about 26 times earnings, a quarter above their own long-term average. At the end of July 2026 the top five positions in the SPY ETF — Apple (7.76%), NVIDIA (7.46%), Microsoft (4.53%), Amazon (3.55%), Alphabet (3.00%) — were worth 26.3% of the ETF, which tracks an index of 500 companies (503 listed stocks, because of dual share classes).
That shares were moving less and less as a bloc could be seen in dispersion: on the eve of earnings season, in July 2026, the Cboe S&P 500 Dispersion Index rose to 47%, its highest in six years. It is the setting in which picking the wrong stock costs more, and in which Goldman Sachs was recommending more diversification and less risk.
A corrective does exist: the equal-weighted S&P 500, which gives each of the 500 companies the same weight, returned 17.88% in the twelve months to 28 July 2026 against 17.57% for the cap-weighted version. Reducing concentration, there, cost nothing; in other phases it had gone the other way. And that is the point: nobody knows in advance which one will win, and diversification exists so that one does not have to guess.
Where diversification does not reach: the lesson of 2022
The decisive limit is that diversification does not protect against systematic risk, and correlations are not constant: they tend to move towards +1 precisely when they would need to stay low. 2022 is the textbook case. The S&P 500 lost 18.11% including dividends and the Bloomberg US Aggregate 13.01%: the worst year in its history and the first time since 1969 that shares and bonds had closed a calendar year in the red together. The 60/40 portfolio gave up 17.5%, its worst since 1937. When the shock comes from inflation and rates the two asset classes are hit by the same cause, and correlation — negative for most of the preceding two decades — shot up to 0.66 in 2022. It has since come back down: between the start of 2025 and mid-2026 it is worth barely 0.11, only just positive, and in some stretches it has turned negative again. Instability, though, works in both directions: in 2025-2026 bonds went back to doing their job as a diversifier.
2026 added a reminder about gold. After a 2025 up more than 60% and a record in early 2026 just below $5,600 an ounce, the metal lost more than a quarter of its value, falling into the $4,000-4,200 area between June and July (−27% from the record and −4.8% year-to-date as at 23 June 2026, according to We Wealth). A safe-haven asset that retreats that far in a few months shows that no single component, however defensive on paper, is a substitute for a well-built portfolio.
The opposite excess: “di-worsification”
If too little diversification is dangerous, too much is useless and expensive. The ironic term di-worsification describes the portfolio that piles up instruments without adding real diversification: three global ETFs, a technology fund and an “innovation” one largely contain the same companies, and what grows is the number of lines, not the exposure. Every instrument brings its own fee, though — between the 0.03% a year of a broad bond ETF and the 0.40% of a specialist one the difference is small over one year and significant over twenty — and twenty positions remain hard to rebalance in moments of stress.
What to look at
- How much do the largest position and the top five weigh? Adding up all the instruments, not fund by fund: it is the only way to bring out overlaps and real geographic exposure.
- How much does the largest sector weigh? If technology is worth 30% of the index and thematic funds on the same theme are held on top of that, real concentration exceeds perceived concentration.
- Do the components really move in different ways? If on days of sharp falls all the lines are red together, the diversification is nominal.
Diversification remains what it was in 1952: the only documented way of reducing avoidable risk without giving up expected return. What has changed is that buying “the market” is no longer enough: one has to look at what is inside it.
Sources: MSCI, MSCI World factsheet (30/06/2026) and MSCI ACWI IMI (29/05/2026); M. Statman, Journal of Financial and Quantitative Analysis, vol. 22 no. 3 (1987), pp. 353-363; H. Markowitz, The Journal of Finance, vol. 7 no. 1 (1952); Evans and Archer (1968) as reconstructed in later reviews; J.P. Morgan Asset Management (May 2026) and RBC Wealth Management (31/12/2025) for the concentration of the S&P 500; Cboe Global Markets (13/07/2026) for the Dispersion Index; MilanoFinanza (24/07/2026) for the July picture; Callan and CNBC for the 1969 precedent; A Wealth of Common Sense for 2022 returns; Morningstar for the 2025-2026 stock-bond correlation; We Wealth (23/06/2026) and Yahoo Finance Italia (07/07/2026) for gold; stockanalysis.com for prices, twelve-month returns, 52-week highs and the composition of the ETFs cited (28-29/07/2026). Past returns are not indicative of future ones and the percentages refer to the dates indicated; the correlation table is for illustrative purposes.
Disclaimer: the information provided in this article is for purely informational and educational purposes and does not in any way constitute personalised financial advice. It is recommended that you consult a qualified professional before making any investment decision.