



At the end of June 2026, assets invested in ETFs worldwide reached 23,090 billion dollars: they were 19,840 at the close of 2025, a growth of 16.3% in six months. During the semester, net inflows amounted to 1,330 billion, the highest ever recorded, and June 2026 was the eighty-fifth consecutive month closed with inflows (ETFGI data).
Behind a three-letter acronym lies the instrument that has changed the way portfolios are built. It's worth understanding the mechanism that sustains it, how much it really costs, how it's taxed in Italy, and in which versions it ceases to be reliable.
What is an ETF
An Exchange Traded Fund is a mutual fund with a decisive peculiarity: its units are listed on the stock exchange and traded during the session like a stock, whereas a traditional fund is subscribed and redeemed once a day at the closing value.
The assets consist of a basket of securities held by a custodian bank and separate from those of the managing company: if the issuer fails, the securities remain with the subscribers. This distinction is important compared to ETNs and ETCs, which are debt securities and carry the credit risk of their issuer.
The vast majority of ETFs are indexed: they don't try to beat the market, they try to copy it. The manager doesn't choose the securities; they replicate them according to the index's public rules, and this absence of discretion is what makes them economical.
The mechanism almost no one explains: creation and redemption
Who guarantees that the exchange price remains close to the value of the securities held by the fund? Alongside the issuer, authorized participants operate: when demand pushes the price above the value of the underlying basket (the NAV), they deliver the securities to the issuer and receive newly issued units to resell; when the price falls below the NAV, they do the reverse.
This daily arbitrage keeps the price anchored to the assets and makes the number of circulating units elastic. It's also why an ETF's liquidity isn't measured by order book volumes, but by that of the underlying securities. The cost of the service is reflected in the bid-ask spread: a few basis points on a heavily traded global ETF, much more on a niche product.
How big the phenomenon is, in three figures
| Market (June 30, 2026) | Assets | Net inflows 2026 | Products |
|---|---|---|---|
| World | 23,090 billion dollars | 1,330 billion dollars | 17,404 ETFs |
| Europe | 3,740 billion dollars | 265.65 billion dollars | 3,902 products |
| Italy (ETFplus) | 221.6 billion euros | — | 2,419 instruments |
In Italy, assets in ETFs, ETCs, and ETNs listed on ETFplus increased from 187.3 billion euros at the end of 2025 to 221.6 billion at the end of June 2026, an 18.3% increase; traded values grew by 60.4% compared to the first half of 2025, and transactions by 72.9%, the most significant progression among Borsa Italiana's segments. The main asset class remains developed market equities, with 104.6 billion, ahead of fixed income with 68.
Active versus passive: what the data really says
The promise of active management is simple: I pay a manager to beat the index. The verification exists, it's called SPIVA (S&P Indices Versus Active) and S&P Dow Jones Indices publishes it twice a year — in the United States since 2002, in Europe since 2014 — correcting for survivorship bias: it also accounts for funds closed or merged during the period, usually disappeared precisely because they performed poorly.
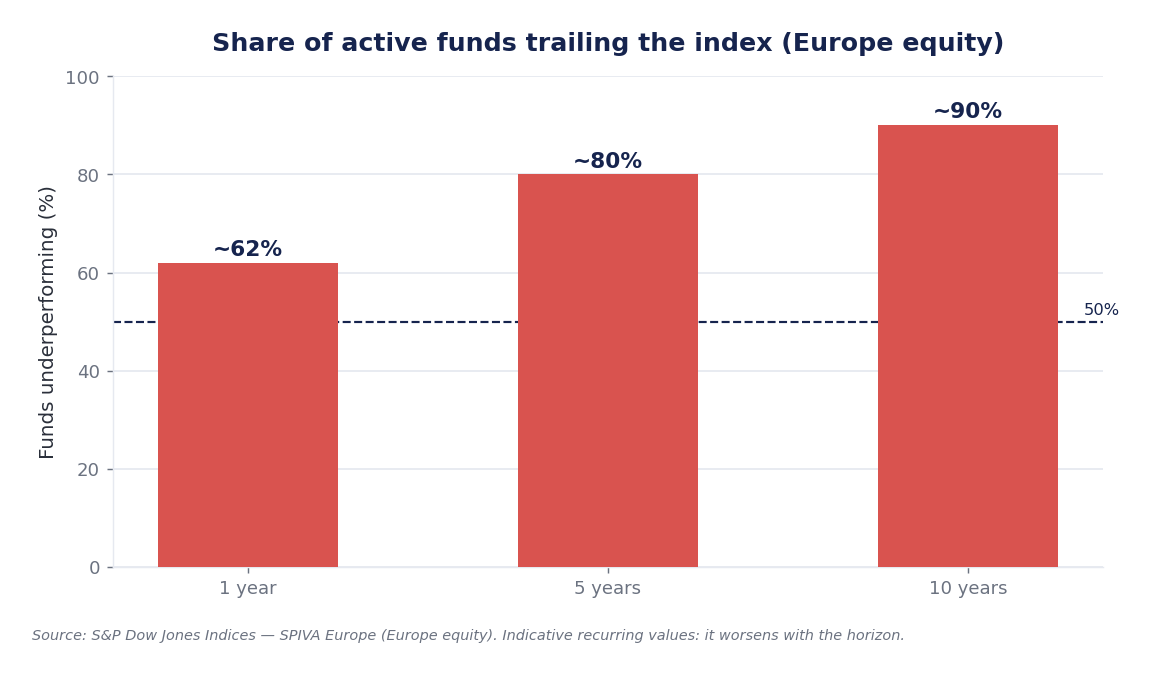
The European results are merciless. In the mid-2025 SPIVA Europe scorecard, for euro-denominated European equity funds compared to the S&P Europe 350, the percentage that remained below the benchmark rose from 71.98% at one year to 89.57% at three years, to 91.78% at five, and to 94.48% at ten. In the same scorecard, at ten years, 98.22% of global equity funds denominated in euros and 97.21% of US equity funds in euros did not beat their respective indices.
In the United States, according to the March 2026 SPIVA U.S. Scorecard, 79% of active large-cap equity funds underperformed the S&P 500 in 2025, compared to 65% in 2024: the fourth worst year in the twenty-five-year history of the survey. For small caps, the percentage remaining below the benchmark rose from 29.7% in 2024 to 41% in 2025, while still being the only one of the three capitalization segments where the majority of managers beat the index: for mid-caps, the percentage below the benchmark is 55%, for large-caps it's 79%. However, the reason indicated by S&P is not the segment's lower efficiency. In 2025, the S&P 500 outperformed the S&P SmallCap 600 by approximately 12 percentage points — the third consecutive year of large companies' advantage — and such a wide gap allows small-cap managers to shift up in capitalization and gain ground on their benchmark: it's a style drift effect, not proof of skill in stock selection. Over long horizons, moreover, the picture reassembles: at fifteen years, there isn't a single one of the 22 US equity categories monitored by SPIVA in which the majority of managers beat their respective indices.
Cost is the only variable you know in advance
Future returns are unknown. Cost is known: this is why the TER (total expense ratio) is the first item to look at in a product sheet. According to justETF, as of July 28, 2026, the 32 UCITS ETFs replicating the MSCI World had TERs between 0.05% and 0.50% annually: the largest in the category, with approximately 124.5 billion euros in assets, costs 0.20%, while other products on the same index are as low as 0.12%, and the cheapest go down to 0.05%.
On the other hand, Morningstar's European Fund Fee Study places Italy among the most expensive markets on the continent for active funds: in the United Kingdom and Switzerland, the average remains below 0.9% annually, in Italy it's almost double. The trend, however, is downward: Morningstar's annual study on US fees, published in 2026, measures a weighted average cost of 0.32% for 2025, with passive products at 0.10% and active equity funds at 0.58%. And this movement is driven by flows: the cheapest quintile collected 694 billion dollars, while the remaining 80% lost 244 billion.
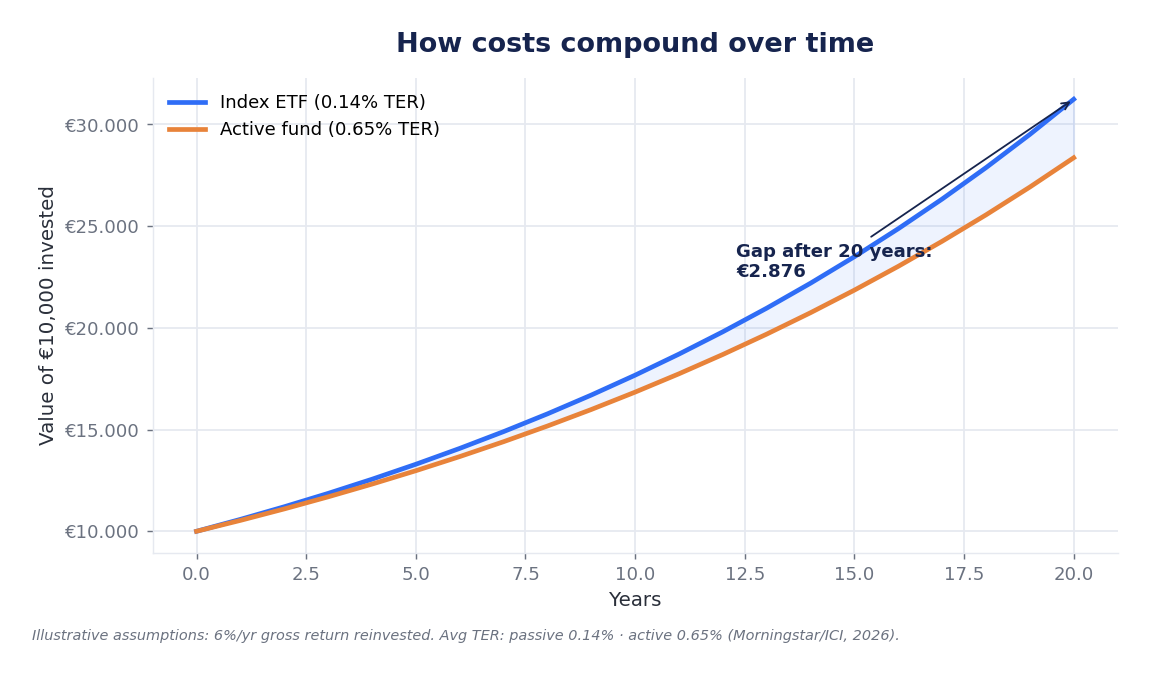
An example illustrates the idea. Let's assume 10,000 euros with a gross annual return of 6% — a working hypothesis, not a forecast — and two cost structures consistent with the cited data: 0.20% for a global ETF and 1.70% for an active fund distributed in Italy.
| Final capital on 10,000 euros, gross return 6% | Cost 0.20% | Cost 1.70% | Difference |
|---|---|---|---|
| After 20 years | 30,883 euros | 23,211 euros | 7,672 euros |
| After 30 years | 54,271 euros | 35,361 euros | 18,910 euros |
This is not market data; it's arithmetic: over twenty years, the difference is worth approximately 77% of the initial capital, over thirty years almost double. For an investment plan of 200 euros per month for twenty years, you reach approximately 88,700 euros versus 75,200, against 48,000 euros invested.
Technical choices that change the outcome
A physically replicated ETF actually buys the index's securities. A synthetically replicated one holds a collateral basket and enters into a swap with banks that commit to delivering the index's return: UCITS regulations limit exposure to a single counterparty in OTC derivatives to 5% of assets, rising to 10% when the counterparty is a supervised credit institution — the typical case for bank swaps. This reduces the tracking error, but adds counterparty risk and less transparency, as the collateral does not match the replicated securities.
An accumulating ETF reinvests dividends and coupons, while a distributing one pays them to the account: in Italy, for accumulating, tax is only paid upon sale; for distributing, it's paid at each ex-date. The underlying currency also matters, not the listing currency: an ETF on the MSCI World bought in euros remains exposed to the dollar for the American portion of the index, 72.45% as of June 30, 2026. Finally, domicile: Irish UCITS ETFs benefit from reduced withholding tax on US dividends, which increases the net return on indices with a strong US weighting.
The TER, finally, does not exhaust the cost: the quality of replication is measured by the tracking difference, the actual deviation between the ETF's return and the index's, which can exceed the TER due to transaction costs and dividend withholding taxes, or remain below it thanks to securities lending. This should be read together with the fund's assets: a very small product risks closure, with an unchosen tax realization.
Italian taxation: the asymmetry few know about
Harmonized ETFs — compliant with the UCITS directive, almost all of those on ETFplus — are subject to a substitute tax of 26% on capital gains and income, which falls to 12.5% on the portion of Italian government bonds and equivalent white list securities. Non-harmonized ETFs, typically under US law, follow IRPEF with rates from 23% to 43%.
The delicate point is another. In Italy, capital gains on an ETF are capital income, while capital losses are diverse income, and the two categories are not offset against each other. Therefore, someone who closes an ETF at a loss and another at a gain pays the full 26% on the gain and carries the loss as a tax credit — the zainetto (little backpack) — usable for four years, but only against diverse income such as capital gains on stocks or bonds. This asymmetry penalizes those who build a portfolio entirely with ETFs.
Those operating with an Italian intermediary under an administered regime receive amounts already net; with a foreign broker, one is under a declarative regime, with tax to be settled in the tax return and foreign assets in the RW section.
Where ETFs stop being boring
- Thematic and sectoral. They concentrate the portfolio on an idea and arrive on the market when the theme is already popular, i.e., already expensive. The balance sheet drawn by Morningstar in the Global Thematic Fund Landscape is severe: over fifteen years, only about one in ten thematic funds survived and beat the global equity index.
- Leveraged and inverse. They multiply the daily movement of the index, not that of the period: leverage is reset every evening, and in a sideways and volatile market, the value erodes even if the index returns to its starting point. These are tactical instruments, not for accumulation.
- Index concentration. A global ETF is as diversified as its index, no more: with 72.45% of the MSCI World in US securities as of June 30, 2026, those who buy "the world" primarily buy Wall Street.
What to watch in the coming months
The first is the growth of active ETFs, which at the end of June 2026 were worth 2,560 billion dollars globally with record inflows of 500.88 billion since the beginning of the year: a hybrid to be judged by the same SPIVA criteria, net of costs and corrected for closed funds.
The second is the concentration of global indices: as long as the US weighting in the MSCI World remains above 70%, the diversification of global baskets is less broad than the name suggests. This is not a reason to avoid them, but to know what you own — which is, after all, the only truly necessary competence for using this instrument well.
Sources: ETFGI, statements on the global and European ETF sector at the end of June 2026; AMF Italia, semi-annual report on the ETFplus market of July 17, 2026, picked up by ETFWorld; S&P Dow Jones Indices, SPIVA Europe Mid-Year 2025 Scorecard (data as of June 30, 2025), SPIVA U.S. Scorecard year-end 2025 (March 2026) and year-end 2024; Morningstar, Annual US Fund Fee Study 2026, European Fund Fee Study and Global Thematic Fund Landscape; justETF (July 28, 2026); MSCI, MSCI World Index fact sheet as of June 30, 2026; Fiscomania for Italian taxation 2026. Simulations on final capital are Hub Finanza elaborations based on assumptions stated in the text, for illustrative purposes: they do not represent expected or promised returns.
Disclaimer: the information provided in this article is for informational and educational purposes only and does not constitute personalized financial advice or investment recommendations. Past returns are not indicative of future results. It is recommended to consult a qualified professional before making any investment decisions.