

On June 5, 2026, Eurostat announced that in the first quarter, euro area GDP had decreased by 0.2% compared to the previous quarter. Three weeks prior, the same institute had reported it as growing by 0.1%. And the author, by querying the Eurostat database on July 29, 2026, finds a third value still: 0.0%. The same quarter, three different numbers in three months. Meanwhile, employment rose by 0.1%. And on July 2, 2026, the US unemployment rate fell to 4.2%, a twelve-month low: a figure economists greeted as bad news.
Four numbers, four traps. GDP and unemployment guide central banks, governments, and markets, but they are among the most misunderstood measures: they change after publication, are calculated differently from one continent to another, and can improve for the wrong reasons. Here’s what they contain, with data published up to July 2026.
What GDP is
Gross Domestic Product is the market value of final goods and services produced in a country over a period. "Final" is the key word: bread is counted, not the flour used to make it, otherwise the same value would be summed at each stage of the supply chain.
It is calculated in three equivalent ways, which measure the same flow from different sides:
- Production: the added value of businesses, how much they produce minus how much they purchase to produce it.
- Expenditure: consumption + investment + government spending + net exports. This is the most cited breakdown, as it shows who drove growth.
- Income: wages + profits + indirect taxes, i.e., how that value is distributed.
In Europe, the calculation is carried out by national institutes — in Italy, ISTAT — according to common rules coordinated by Eurostat. In the expenditure formula, imports are subtracted not because they "do harm," but because consumption and investment already include them.
Nominal versus real
Nominal GDP is at current prices; real GDP is adjusted for inflation: only the latter indicates whether more was produced or if prices merely rose. According to the European Commission's forecasts of May 21, 2026, the euro area will close 2026 with inflation at 3.0% and real growth at 0.9% (1.2% in 2027): nominal GDP would grow by approximately four points, while real GDP would grow by less than one.
Data is not final: the lesson of revisions
This is the point that textbooks relegate to a footnote but which is very important in practice: GDP is revised. Initial estimates are released quickly based on incomplete information; subsequent ones incorporate fiscal and balance sheet data that arrive later. In 2026, the two sides of the Atlantic provided two opposite examples.
The two columns are not comparable: Eurostat publishes the quarter-on-quarter variation, while the BEA publishes the annualised rate, projected over twelve months. A +0.5% European figure and a +2.0% American figure indicate roughly the same speed.
| Q1 2026 estimate | Euro area (q-o-q change) | United States (annualised rate) |
|---|---|---|
| First estimate | +0.1% (April 30, 2026) | +2.0% (April 30, 2026) |
| Second estimate | +0.1% (May 13, 2026) | +1.6% (May 28, 2026) |
| Subsequent estimate | −0.2% (June 5, 2026) | +2.1% (June 25, 2026) |
| Current value | 0.0% (database as of July 29, 2026) | — |
In the euro area, the revision changed the sign, from marginal growth to contraction, and cut the annual comparison from +0.8% to +0.3%; by the end of July 2026, the same database shows the quarter at 0.0% and the year-on-year at +0.5%. In the United States, the estimate first fell by almost half a point and then rose above the initial level, due to a recalculation of imports. In both cases, the initial day's commentary rested on a number that later changed: a single quarterly estimate is not an acquired fact.
The economic cycle and recessions
Economies alternate between expansion and recession. The rule of two consecutive quarters of falling GDP is a practical convention, not an official definition: in the United States, official dating is the responsibility of the National Bureau of Economic Research, and in the euro area, of the Euro Area Business Cycle Dating Committee of the CEPR, active since 2002, which has formally dated the contractions of 2008-2009, 2011-2013, and 2020.
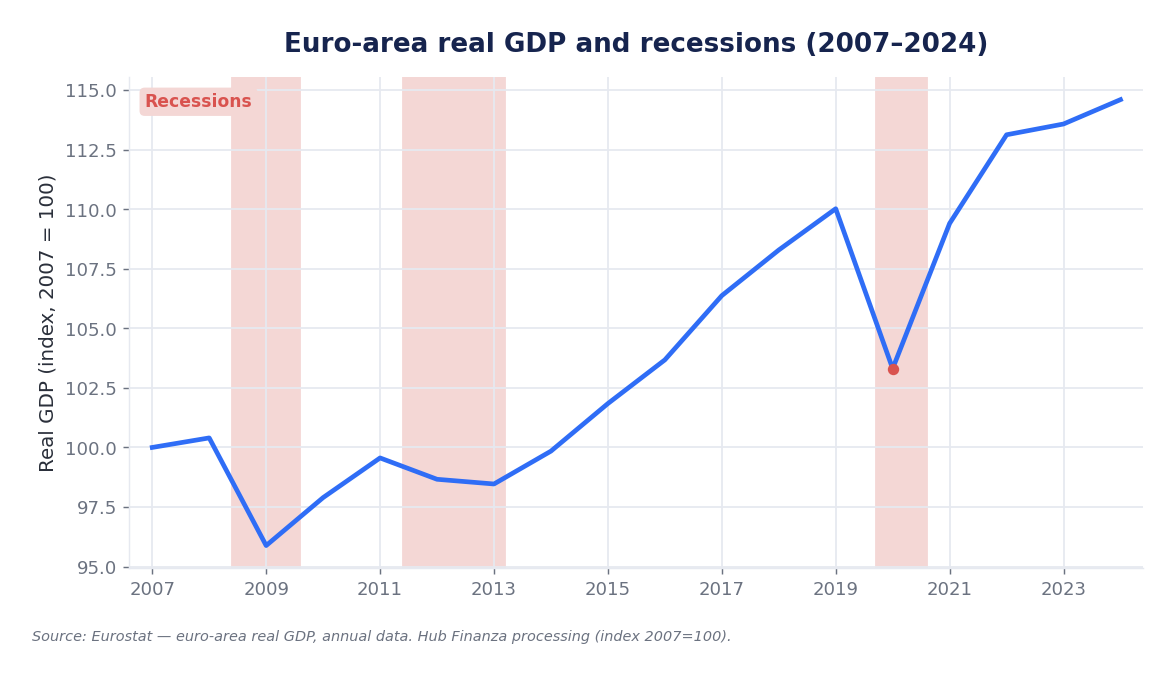
In twenty years, the euro area has gone through three negative phases: the 2008-09 financial crisis (real GDP −4.5% in 2009), the 2011-13 sovereign debt crisis, and the 2020 Covid shock (−6.1%), the fastest decline ever recorded, followed by a rebound of +5.9% in 2021.
The recent picture is one of slow but positive growth: +0.9% in 2024 and +1.4% in 2025 (+1.5% in the Union), according to Eurostat data confirmed on March 6, 2026. The −0.2% in the first quarter of 2026 is a step backward, not yet a recession: the second quarter, expected in its first estimate on July 30, 2026, will be needed.
Unemployment: how it is measured
The definition is not intuitive, and that's where misunderstandings arise. According to the International Labour Organization guidelines adopted by Eurostat, an unemployed person is someone between 15 and 74 years old who did not work in the reference week, is available to start within two weeks, and has actively sought work in the previous four weeks.
Those who are not looking for work are not unemployed: they are inactive. For this reason, three numbers should be read together:
- Unemployment rate: unemployed people as a percentage of the labour force, not the population.
- Participation rate: how much of the working-age population is in the labour force. This is the denominator: if it shrinks, the unemployment rate falls without anyone having found a job.
- Employment rate: how many, out of the working-age population, actually have a job: the least ambiguous measure.
Finally, a distinction is made between frictional unemployment (the time between jobs), structural unemployment (mismatched skills or regions), and cyclical unemployment: only the latter is affected by interest rates and budgets.
When a falling rate is bad news
The US employment report of July 2, 2026 is a textbook case. The unemployment rate fell to 4.2%, a twelve-month low. This sounds like good news: it wasn't.
In the same month, jobs created by businesses were just 57,000, against expectations of around 115,000, and April and May were revised downwards by 74,000. More importantly, the household survey recorded 507,000 fewer employed persons, and the participation rate fell by 0.3 percentage points to 61.5%, the lowest level in fifty years excluding the pandemic period.
The mechanics are simple: those who stop looking for work exit the labour force and disappear from both the numerator and the denominator. The ratio improves while the economy worsens.
The link between GDP and labour: Okun's law
GDP and unemployment move in opposite directions, but with a lag: when production falls, companies don't immediately lay off staff, because finding and training personnel is costly. This regularity, formalised by Arthur Okun in 1962, is Okun's Law.
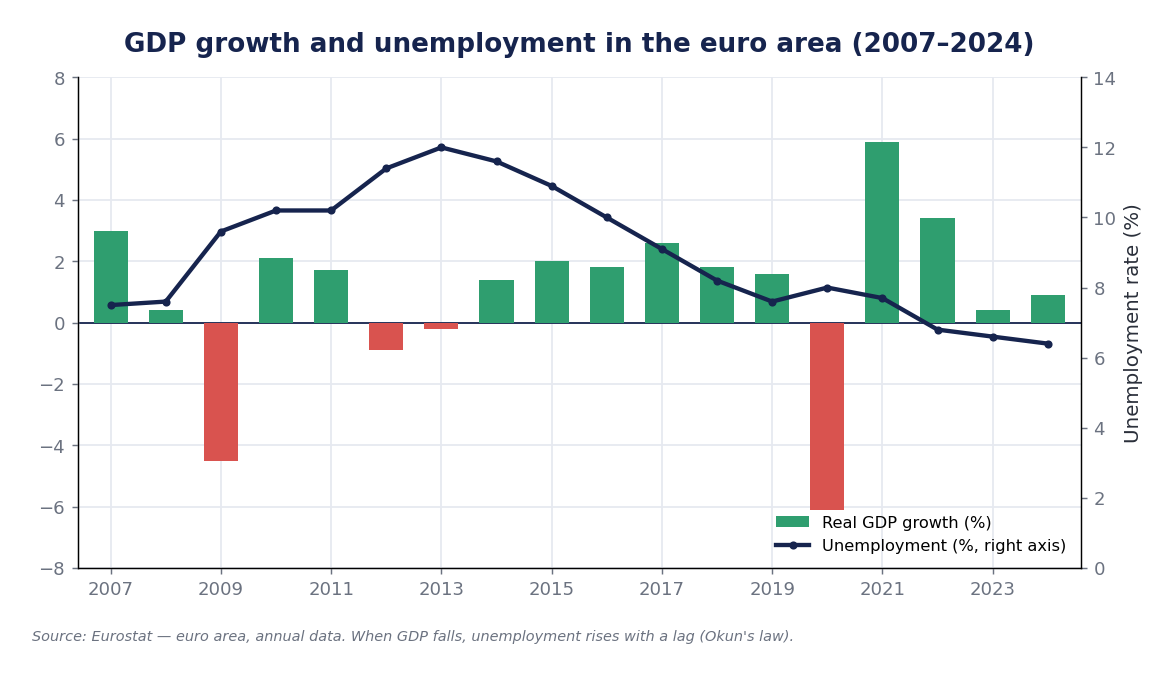
After the 2009 crash, euro area unemployment continued to rise for years, reaching a peak of 12.2% in 2013 — four years after the GDP low — before falling to an annual average of 6.4% in 2024. 2020 was an exception: it rose much less than expected because public wage support schemes maintained employment relationships.
The first quarter of 2026 reiterates the asymmetry in miniature: GDP stalled at 0.0% and employment +0.1%. Unchanged production with more employed people means falling productivity: it protects incomes in the short term, but compresses margins and makes cuts more likely if weakness persists.
Differences within the euro area
The aggregate data conceals very different economies, and in the first quarter of 2026, it did so in an almost caricatural way: the euro area appeared stagnant, but Spain, Germany, and Italy were all growing. The aggregate was held flat almost entirely by Ireland, whose quarterly GDP is reported at −7.0%: weighing approximately 3.8% of the area, it alone subtracted over a quarter of a point. This is a textbook case of Irish GDP, inflated and deflated more by the balance sheets of multinational corporations based there than by the country's real economy.
| Country | GDP, Q1 2026 | Unemployment, May 2026 |
|---|---|---|
| Spain | +0.6% | 10.3% |
| Germany | +0.3% | 3.8% |
| Italy | +0.3% | 5.0% |
| France | −0.1% | 8.2% |
| Ireland | −7.0% | 4.4% |
The 6.2% figure for May 2026, down from 6.3% a year earlier, corresponds to 10,986,000 people in the euro area and 13,163,000 in the Union (5.9%). The range extends from 2.9% in Bulgaria and Czechia to 10.6% in Finland; youth unemployment remains the sore point, at 14.7%.
Italy, according to ISTAT, recorded a rate of 5.0% in May 2026, among the lowest in its recent history, with 228,000 more employed people year-on-year. But a three-indicator reading is needed: in the same month, the employment rate fell to 63.0% and inactivity rose to 33.6%. The Italian issue is not those looking for work without finding it, but how many are not looking at all.
What GDP does not measure
GDP does not indicate how wealth is distributed, does not count unpaid work or the shadow economy, ignores environmental sustainability — reconstruction after a disaster increases it, the disaster itself does not reduce it — and does not measure health or quality of life. This is not a defect: it is the scope for which it was designed in the 1930s. Complementary indicators are needed alongside it, from ISTAT's equitable and sustainable well-being indices to GDP per capita.
Why central banks observe them
The BCE has a primary objective, inflation at 2% in the medium term, but to achieve it, it must read the cycle: an overheated economy, with low unemployment and accelerating wages, tends to generate inflation. On July 23, 2026, the Governing Council left interest rates unchanged — 2.25% on deposits, 2.40% on main refinancing operations, 2.65% on the marginal lending facility — amidst energy uncertainties and geopolitical tensions.
However, GDP is a lagging indicator, and unemployment is even more so. For this reason, leading indicators are observed: confidence, orders, PMI indices, and the job vacancy rate, which in the first quarter of 2026 was 2.3% in the euro area, up from 2.2% at the end of 2025 but below 2.4% a year earlier. A solid labour market, cooling at the edges.
What to watch in the coming months
- The second quarter of 2026 for the euro area, expected on July 30 and updated on August 14, 2026: after a negative quarter, a second negative sign would reopen the recession discussion.
- The relationship between employment and production. If less is continuously produced with more employed people, the sustainability of employment is not long-term.
- Participation, not just unemployment: the European Commission forecasts employment to decelerate to 0.3% in 2026.
Neither should be read alone, upon first release, or without context: they move markets precisely because they are imperfect.
Sources: Eurostat, quarterly national accounts (April 30, May 13 and June 5, 2026; March 6, 2026 for annual data 2024-2025), «Euro area unemployment at 6.2%» (July 2, 2026) and «Unemployment statistics» for May 2026 rates and ILO definition, «Euro area job vacancy rate at 2.3%» (June 16, 2026); ISTAT, «Occupati e disoccupati — maggio 2026» (July 2, 2026); BCE, monetary policy decisions (July 23, 2026); European Commission, «Spring 2026 Economic Forecast» (May 21); Bureau of Economic Analysis, US Q1 2026 GDP estimates (April 30, May 28, June 25); Bureau of Labor Statistics, «The Employment Situation — June 2026» (July 2, 2026), picked up by CNBC, TD Economics, Indeed Hiring Lab and Fortune. National accounts data are subject to revision.
Disclaimer: the information provided in this article is for informational and educational purposes only and does not constitute personalized financial advice in any way. It is recommended to consult a qualified professional before making any investment decisions.