

In June 2026, euro area inflation was 2.8% and Italian inflation was 3.0%: far from the 10.6% of autumn 2022, but above the 2% target — enough for the European Central Bank to have raised rates for the first time since 2023 on June 11, 2026. Inflation is not a closed chapter: it returned in 2026, and the cause is energy. This guide explains what it is, how it is measured, where it comes from, and why it erodes savings, with data published up to July 2026.
A simple definition
Inflation is the general and sustained increase in the prices of goods and services: not the price hike of a single product, but the average movement of an entire basket. With 3% inflation, what costs 100 € today will cost on average 103 € next year; reversing the logic, 100 € left in a drawer for twelve months will be worth, in purchasable goods, 97.09 €. The loss does not appear on any bank statement, but it is there.
To be distinguished: inflation (prices rise), disinflation (they rise more slowly: between May and June 2026, the euro area rate fell from 3.2% to 2.8%, but prices were still growing), and deflation (they fall).
How it is measured: the basket, and why there are three indices in Italy
The cost of a basket representative of household consumption is compared with that of the same basket one year earlier. In Italy, ISTAT constructs it: from January 2026, the indices are on a 2025 = 100 base and adopt the European ECOICOP version 2 classification, which increases the expenditure divisions from 12 to 13 and breaks down the basket into 531 product aggregates for NIC and FOI and 537 for IPCA. And a single number is not enough, because three indices coexist in Italy.
| Index | What it measures | What it is used for |
|---|---|---|
| NIC | Prices for the entire national community | It is the "official" Italian inflation, the one reported in newspaper headlines |
| FOI | Prices for blue- and white-collar worker households | Monetary revaluations provided for by law or contract; net of tobacco products, it indexes the BTP Italia |
| IPCA | Harmonised index according to European rules | Comparisons between EU countries; net of imported energy products, it is the reference for contract renewals |
At the European level, the official index is the HICP, calculated by Eurostat with rules common to all countries. It is released twice — a flash estimate at the end of the month, final data two weeks later — and the two figures can differ: in March 2026, the estimate was 2.5%, the final figure 2.6%.
Headline inflation and core inflation
Headline inflation includes everything; core, or underlying, inflation excludes the most volatile components to capture the trend related to domestic demand and wages. However, pay attention to the scope, which is not the same: Eurostat removes energy, food, alcohol, and tobacco, while ISTAT removes energy and fresh food. The gap between headline and core indicates the type of inflation observed: in June 2026, the euro area recorded 2.8% headline and 2.4% core, while in Italy the gap was much wider, 3.0% versus 1.6% — although part of the breadth depends precisely on the two different definitions. Translated: about half of Italian inflation that month came from energy and fresh food, not from an overheating of the domestic economy, given that the core component was even below the target, at 1.6%.
Then there are the contributions: of the 2.8 points in the euro area in June 2026, 1.51 came from services (+3.2%), 0.77 from energy (+8.5%), 0.29 from food, alcohol, and tobacco (+1.5%), and 0.18 from non-energy industrial goods (+0.7%).
Where it comes from
- Demand-pull: spending grows faster than productive capacity.
- Cost-push: energy, raw material, or wage increases lead businesses to pass on costs to prices: this is what happened in 2022 and 2026.
- Expectations-driven: if households and businesses take for granted that prices will rise, they adjust prices and wage demands in advance, and the expectation becomes self-fulfilling.
The third channel is the most feared: it is the only one that transforms a temporary shock into persistent inflation. In the ECB's consumer expectations survey, the twelve-month median jumped from 2.5% in February 2026 to 4.0% in March, then fell back to 3.0%: the jump occurred, but not entrenchment. Wages are also stable: the ECB's wage tracker, which monitors collective agreements, indicated wage growth of 2.3% in 2026, down from 3.2% in 2025, on July 29, 2026. At these rates, the "price-wage spiral" remains theoretical.
2026: how an energy shock brings inflation back above 2%
2026 is a case study of cost-push inflation. The year began below target; from March, the conflict in the Middle East caused energy prices to soar, and in four months the index rose by one and a half percentage points, from 1.7% in January to 3.2% in May.
| Month 2026 | Euro area HICP | Note |
|---|---|---|
| January | 1.7% | Energy falling (−4.1%) |
| February | 1.9% | Energy still negative |
| March | 2.6% | Energy returns to positive (+5.1%) |
| April | 3.0% | Energy +10.9% |
| May | 3.2% | Highest value since 2023 |
| June | 2.8% | Energy +8.5%, core at 2.4% |
Behind the curve is oil. In the Eurosystem's June 2026 projections, the technical assumption for crude oil for the second quarter was 112 dollars per barrel, 25% more than in March and over 75% more than in December 2025; Brent had exceeded 110 dollars, the highest since mid-2022. Then the suspension of hostilities between the United States and Iran — Washington halted raids and Tehran stated it would not strike as long as the pause holds, but a formal agreement is not in place — reversed the movement: on July 27, 2026, the September future lost 8.7%, closing at 88.36 dollars.
In Italy, the shock was surgical: in June 2026, non-regulated energy products grew by 12.9% annually and regulated ones by 9.3% (from 5.6% in May), while the "shopping basket" stopped at +1.6%. In the United States, the same story, a few weeks earlier: the June 2026 CPI registered 3.5% annually from 4.2% in May, core at 2.6%, with the Federal Reserve holding fed funds steady at 3.50%-3.75%. Another counter-intuitive mechanism, base effects, also matters: since the annual rate compares today's prices with those of twelve months ago, a sharp increase impacts the index for one year and then drops out of the comparison even if prices have not returned to their previous levels. This is why inflation falls while utility bills remain high.
Why the target is 2%
In the strategy review concluded in 2025, the ECB confirmed a symmetric 2% medium-term target: symmetric because upward and downward deviations are equally undesirable, medium-term because every monthly fluctuation is not pursued. Why not zero? Because low but positive inflation allows relative prices to adjust without nominal wage cuts and keeps deflation at bay, which encourages postponing purchases and increases the real value of debts.
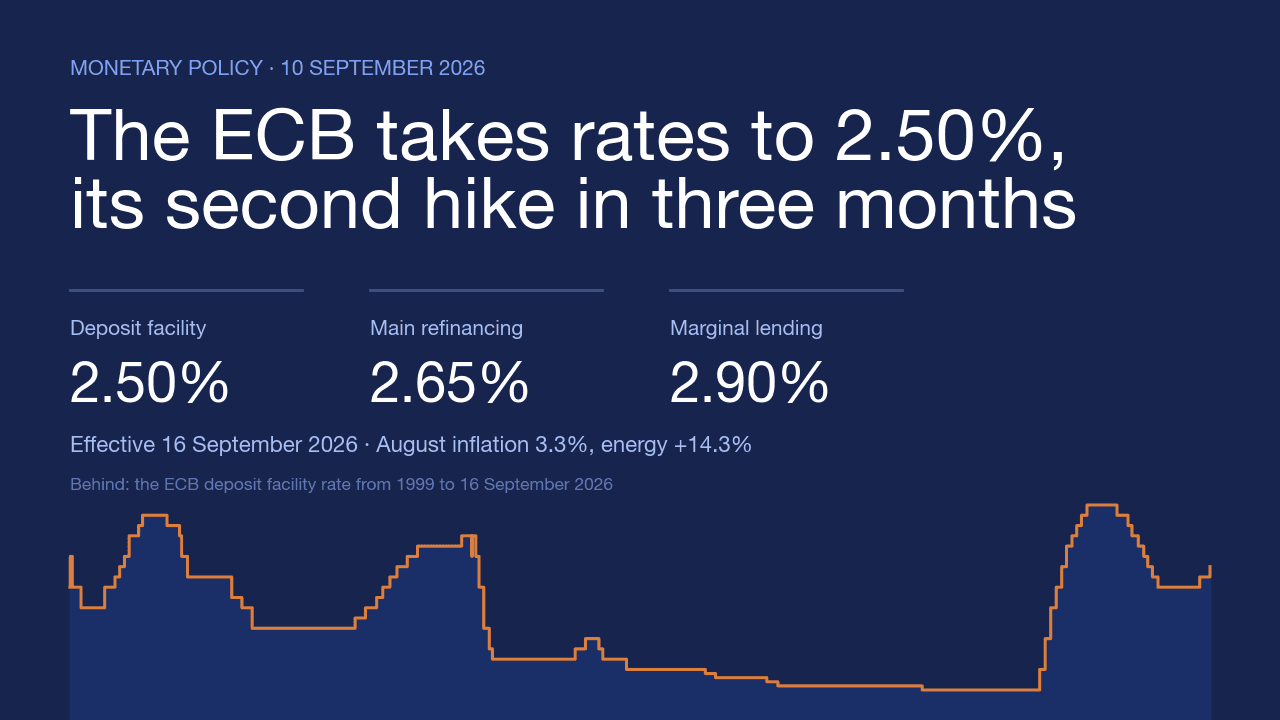
In 2026, this translated into two decisions. On June 11, 2026, the Governing Council unanimously raised the three key interest rates by 25 basis points, bringing the deposit facility rate to 2.25%, the main refinancing operations rate to 2.40%, and the marginal lending facility rate to 2.65%, effective June 17: the first hike after the series of cuts initiated in 2024. On July 23, 2026, rates remained unchanged.
| Euro area inflation (HICP) | 2026 | 2027 | 2028 |
|---|---|---|---|
| Eurosystem projections (June 2026) | 3.0% | 2.3% | 2.0% |
| Excluding energy and food | 2.5% | 2.5% | 2.2% |
| ECB Survey of Professional Forecasters (July 2026) | 2.7% | 2.2% | 2.0% |
In the ECB's Survey of Professional Forecasters, long-term expectations (2031) remained at 2.0%: this is the most important signal, as it means the 2026 shock is viewed as temporary.
The precedent: the 2021-2023 shock
Post-Covid reopenings, supply bottlenecks, and the energy shock following the invasion of Ukraine pushed euro area HICP to a peak of 10.6% in October 2022.
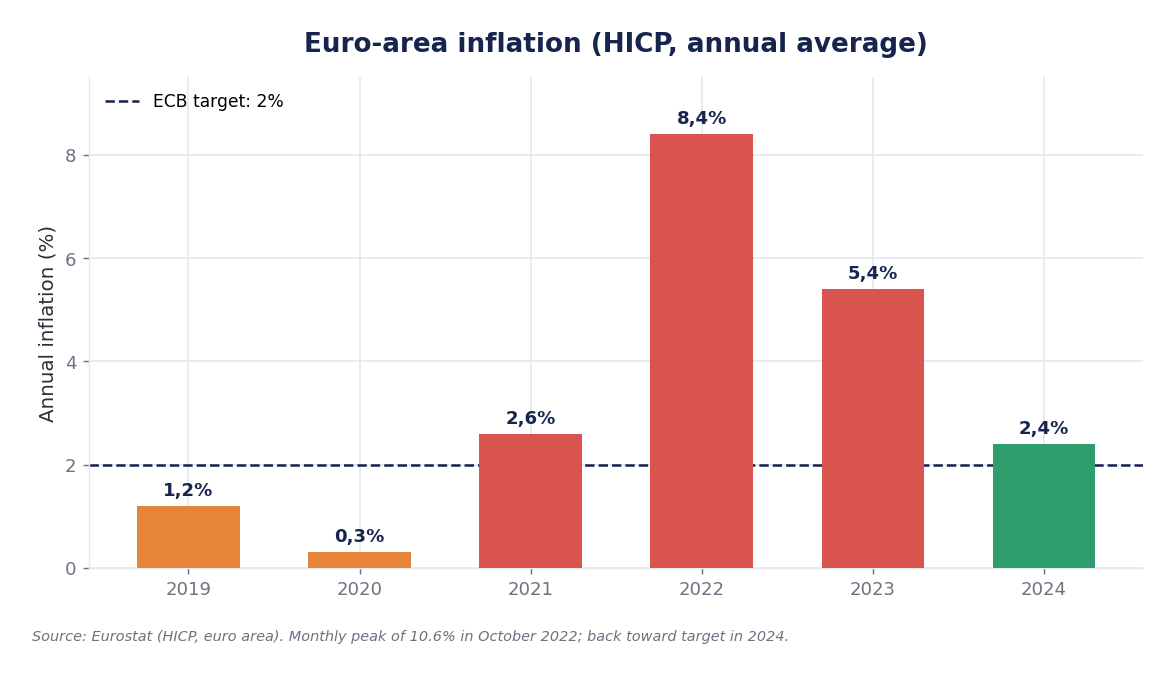
The decline was gradual: annual average of 8.4% in 2022, 5.4% in 2023, 2.4% in 2024, and 2.1% in 2025. But once prices rise, they do not return to their previous level: compounding the annual averages for the four-year period 2022-2025 yields a cumulative increase of approximately 19.5%. A basket that cost 100 € in 2021 cost an average of about 119.50 € in 2025: those who held stagnant liquidity lost approximately 16% of their purchasing power.
Why it concerns you: the erosion of purchasing power
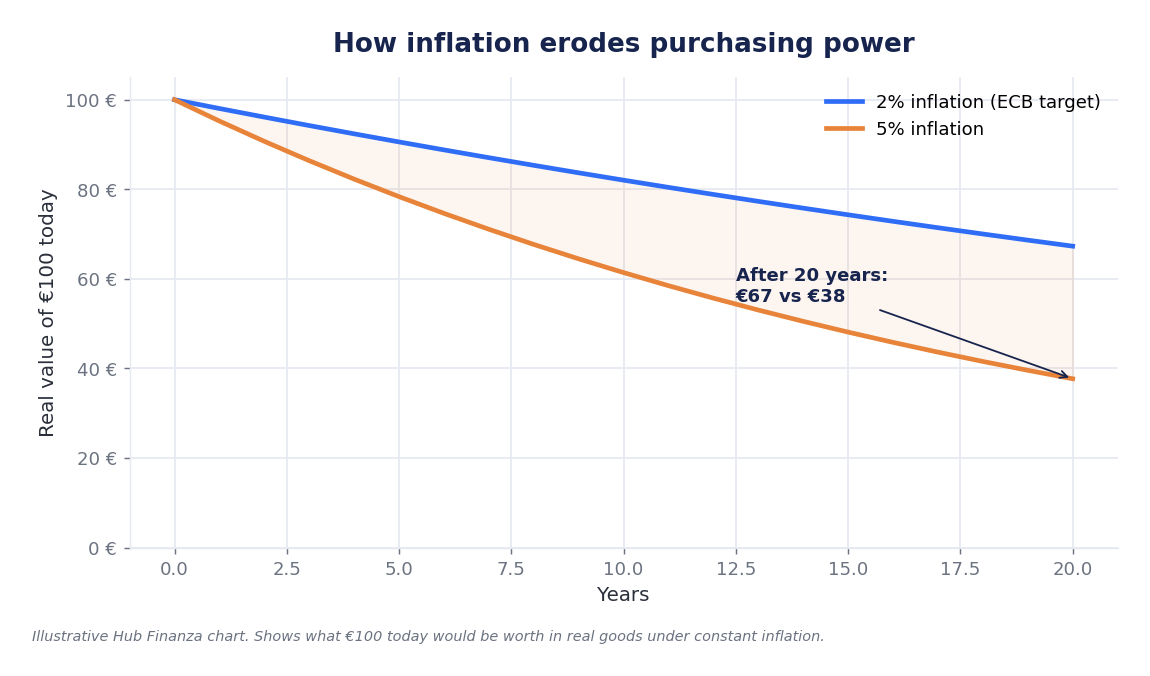
The difference between 2% and 5% is not one of degree but of nature. What is the purchasing power value of 100 € left idle:
| Average annual inflation | After 5 years | After 10 years | After 20 years |
|---|---|---|---|
| 2% (ECB target) | 90.57 € | 82.03 € | 67.30 € |
| 3% (Italy, June 2026) | 86.26 € | 74.41 € | 55.37 € |
| 5% | 78.35 € | 61.39 € | 37.69 € |
The operational concept is called real return: nominal return minus inflation. At the end of July 2026, the ECB's deposit facility rate was 2.25%, below euro area inflation in June (2.8%): even remunerated liquidity at the reference rate was losing ground. The ten-year BTP yielded around 3.9-4.0%, with a Bund spread between 80 and 84 basis points: against Italian inflation of 3.0%, approximately one point of gross real return, which taxes further reduce.
Instruments designed for this purpose are indexed bonds: in Italy, the BTP Italia, linked to FOI net of tobacco, and the BTP€i, linked to the European harmonised index. The BTP Italia "Sì", placed from June 15 to 19, 2026, offers a minimum real rate of 1.60% in addition to inflation recovery until June 23, 2031, and raised 8,842.6 million. Caution: they protect against realized inflation, not against expected inflation, which is already priced in.
What to watch in the coming months
- Energy prices: the variable that brought European inflation back above 3% is the same one that can bring it back towards 2%.
- Services and wages: in June 2026, services grew by 3.2% and accounted for over half of euro area inflation; the ECB wage tracker, with 2.7% expected in the first quarter of 2027, will indicate if they are cooling down.
- Expectations: consumer expectations have fallen from 4.0% to 3.0% over twelve months and stand at 2.8% over a three-year horizon, while professional forecasters remain at 2.0% over the long term. This is the barometer of the central bank's credibility.
- ECB decisions: after the pause on July 23, 2026, the next meeting is on September 10, 2026.
- Carried-over inflation, the average annual rate that would be achieved if prices remained stable until December: in June 2026, it was +2.6% in Italy.
Sources: Eurostat, final HICP data for June (07/17/2026), May (06/17/2026), and March 2026 (04/16/2026) and flash estimates from 04/30, 03/31, 03/03, and 02/04/2026; ISTAT, «Consumer prices — June 2026» (07/16/2026) and «Informative note on the 2026 basket» (02/23/2026); ECB, monetary policy decisions of 07/23/2026, press conference of 06/11/2026, Eurosystem projections of June 2026, Survey of Professional Forecasters (07/24/2026), consumer expectations survey of June 2026 (07/24/2026), wage tracker (07/29/2026), and Annual Report 2025; Banca d'Italia, summary of the monetary policy strategy review; MEF, BTP Italia «Sì» (June 2026); US Inflation Calculator based on Bureau of Labor Statistics data, CPI of June 2026 (07/14/2026); CNBC (07/27/2026) for Brent. Data are subject to revision; Hub Finanza charts are for illustrative purposes.
Disclaimer: the information provided in this article is for informational and educational purposes only and does not constitute personalized financial advice in any way. It is recommended to consult a qualified professional before making investment decisions.