

The energy transition of 2026 is told through two numbers that seem to contradict each other. The world invests in clean energy almost double what it invests in fossil fuels. Yet, the large listed oil groups do the exact opposite: they cut back on renewables, devalue green portfolios, and return to oil and gas.
In 2026, a third element was added that no industrial plan had foreseen: the Strait of Hormuz crisis. On 23 April 2026, the executive director of the International Energy Agency (IEA) Fatih Birol spoke of the greatest threat to energy security ever faced: approximately 13 million barrels per day withdrawn from the market, compared to about 5 million during the 1973 and 1979 shocks.
The overall picture: 3.400 billion dollars, and who gets them
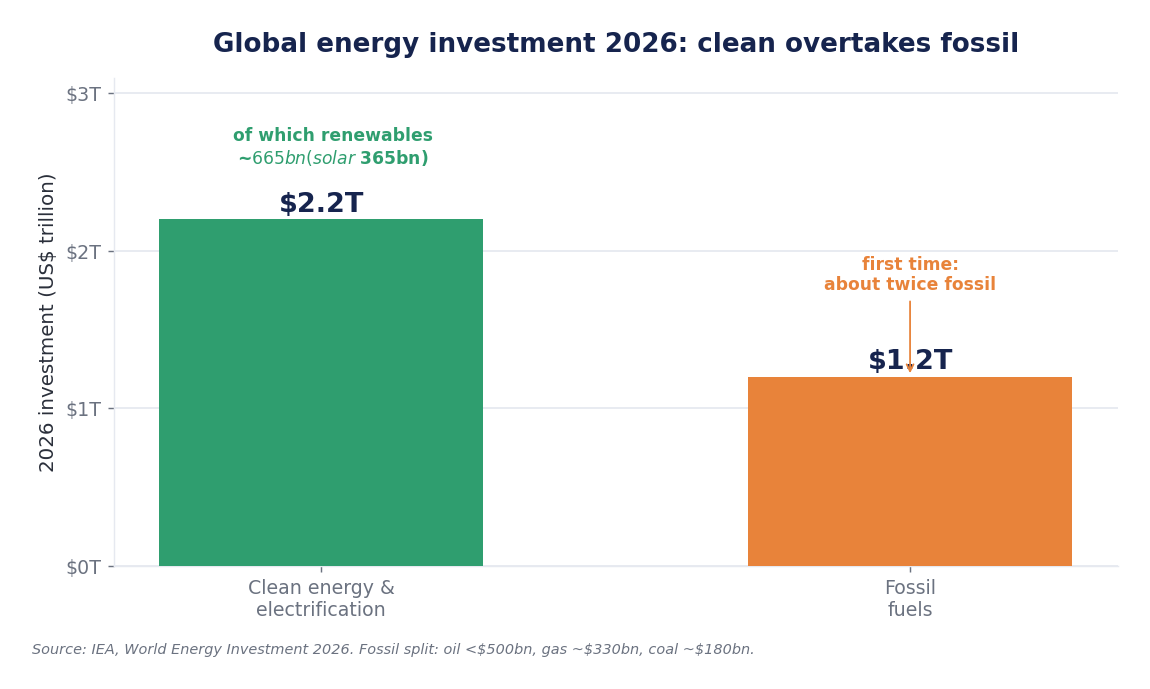
The World Energy Investment 2026 report, presented by the IEA on 28 May 2026, estimates global energy investments at approximately 3.400 billion dollars, a slight increase over 2025 (when the IEA itself indicated about 3.300 billion): an increase of about 3%, which the IEA does not quantify as a percentage. Of these, approximately 2.200 billion go to renewables, nuclear, grids, storage, low-emission fuels, efficiency, and electrification, and approximately 1.200 billion to oil, gas, and coal.
| Item | 2026 estimate (billion dollars) |
|---|---|
| Total energy | about 3.400 |
| Solar PV | 365 |
| Renewables (total) | 665 |
| Electricity grids | about 550 |
| Battery storage | over 100 |
| Nuclear | over 80 |
| Oil (upstream) | less than 500 |
| Natural gas | about 330 |
| Coal | about 180 |
In 2015, clean energy accounted for about 44% of global energy spending, in 2025 about two-thirds. Electricity supply alone with its infrastructure is worth about 1.600 billion in 2026, 2.000 billion with the electrification of end uses.
2026 is not 2025: energy security changes the game
In the headline "clean doubles fossil", a detail is lost. In 2025, the IEA estimated a total of 3.300 billion, with 2.200 billion for clean and 1.100 billion for fossil. In 2026, clean energy remains at 2.200 billion and fossil rises to about 1.200 billion, so it's fossil that grows in absolute terms. Not due to ideological rethinking, but for security of supply.
The supply shock is unprecedented: according to IEA data reported by Fortune on 23 April 2026, transit in the Strait had fallen to 3-5 tankers per day against an average of 129 before the conflict, with mine clearance estimated to take up to six months. On 29 July 2026, Brent was trading at approximately 89.5 dollars per barrel (+22.7% in July alone, +23.5% since the beginning of the year) and the Amsterdam TTF future opened at 58.82 euros per megawatt-hour. In September 2025, Wood Mackenzie built oil companies' 2026 budgets on an average Brent just under 60 dollars.
Security thus pushes capital in two opposite directions simultaneously. Towards non-oil fossil fuels: gas rises by over 10% to about 330 billion, a ten-year high, with LNG spending more than doubling, and coal reaches 180 billion, its highest since 2012, with China accounting for about 70%. And towards electricity, because sun, wind, and nuclear do not pass through a strait that can be mined: in 2025, clean energy and efficiency saved importing countries about 260 billion in fossil fuel imports.
The only fossil fuel item in decline is upstream oil, below 500 billion for the third consecutive year: crude oil prices rise, but no one commits twenty-year capital to a barrel whose value depends on a naval blockade.
Why majors are hitting the brakes on green: the math of returns
If global capital favors electrification, why are majors moving in the opposite direction? The answer lies in the relationship between expected returns and the cost of capital. Wood Mackenzie, on 3 March 2025, quantified the divergence as follows: yet-to-be-approved upstream projects offer double-digit returns, while onshore solar and wind remain at "comparatively modest" returns. European majors, who allocated 30% of investments to low-carbon in 2024, are repositioning to 15-20%.
It's not that solar doesn't earn money: it earns money in a different way. A photovoltaic park with a twenty-year contract resembles a bond—stable cash flows, limited returns, strong sensitivity to interest rates; a field resembles an option on the barrel price. Utilities, which finance themselves at lower debt costs, are better suited to the first model. The retreat of the majors does not mean that the transition is not working: it means that those companies are not the right vehicle to finance it.
| Company | Announced investments | Commitment to low-carbon |
|---|---|---|
| BP | 13-15 billion per year until 2027, of which about 10 billion in oil and gas | 1.5-2 billion per year, about 5 billion less than previous guidance |
| Shell | 24-26 billion cash in 2026, of which about 4 billion for ARC Resources | up to 10% of capital employed in low-emissions by 2030 |
The BP case is the clearest. After the "reset" of February 2025—with then-CEO Murray Auchincloss admitting to having gone "too far, too fast"—the group raised its 2030 production target to 2.3-2.5 million barrels of oil equivalent per day. The bill arrived in the financial statements: on 15 January 2026, BP announced write-downs of 4-5 billion dollars for the fourth quarter of 2025, predominantly on gas and low-emission activities, following 881 million in the first nine months of 2025 and 1.86 billion in 2024. The company did not break down the amount by individual project. From 1 April 2026, the company is led by Meg O'Neill, former Woodside Energy.
Shell has chosen the same direction for acquisitions: on 27 April 2026, it announced the purchase of Canadian ARC Resources, which adds approximately 370.000 barrels of oil equivalent per day. The operation is worth 16.4 billion dollars including approximately 2.8 billion of net debt assumed; the consideration to shareholders is 13.6 billion (3.4 billion in cash and 10.2 billion in shares). It's the same operation that other news outlets report as 22 billion Canadian dollars: three different figures for the same agreement, depending on what is measured and in which currency. Gas and liquids, not electrons. On the same line, Equinor, which halved its spending on renewables to 5 billion over two years, and TotalEnergies, which raised its share of new oil & gas projects to 40% from 34%.
Who is buying green: China, United States, Europe
China. In the first half of 2026, 72.07 GW of photovoltaic capacity were installed, 66% less than in the same period of 2025, and 38.62 GW of wind power (−25%), according to the National Energy Administration. This is almost entirely a comparison effect: in 2025, developers rushed to complete projects before market prices for new renewables, from 31 May 2025, bringing the year to approximately 317 GW of solar and 120 GW of wind, both records. At the end of June 2026, China's installed capacity was 4.04 TW, with solar at 1.274 TW (31.5%).
United States. Here, the decisive variable is fiscal. The budget law of 4 July 2025 canceled the 30% domestic tax credit from 1 January 2026: wind and solar projects that begin work after 4 July 2026 must enter operation by the end of 2027, while those that started earlier have four years. This led to a rush to "secure" construction sites, with over 200 GW in direct current of protected projects. In the first quarter of 2026, installations totaled 7.8 GW, 27% less year-on-year.
Europe. On 22 April 2026, in response to the Hormuz crisis, the European Commission presented the AccelerateEU package: 100 GW per year of new renewable capacity, authorizations within two years from the end of 2026, acceleration on grids and nuclear, and storage from approximately 55 GW towards 200 GW by 2030.
Electricity is the real battleground
According to the mid-year update of the IEA's Electricity report, dated 23 July 2026, global electricity demand will grow by 3.6% in 2026 and 3.8% in 2027, after 3% in 2025, driven by industry, electric vehicles, air conditioning, and data centers: 30.700 TWh in 2027, from 28.600 in 2025.
On the supply side, 2026 marks a historical overtake: renewable generation grows by over 8% and becomes the world's primary source of electricity, surpassing coal, with its share rising from 33% in 2025 to an expected 37% in 2027. Solar adds approximately 600 TWh and overtakes wind as the second renewable source after hydropower.
However, it is not a clean victory: the IEA estimates for 2026 an increase in coal generation of 1.4%, due to the replacement of increasingly expensive gas, and CO₂ emissions from the electricity sector growing by about 1%. This is the least told side effect of the crisis.
Market interpretations
In the twelve months ending 28 July 2026, the US energy sector ETF XLE returned approximately 36.3% including dividends, compared to approximately 24.4% for the global clean energy ETF ICLN. But both gained: not a rotation from green to black, but a general rise where the geopolitical leverage favored oil sellers more. A risk premium, not a judgment on technology.
What to watch now
The first element is the reopening of Hormuz: if clearance proceeds within the timelines indicated by the IEA, the geopolitical premium on the barrel deflates and with it much of the oil outperformance; if the blockade continues, the impetus on LNG, coal, and renewables holds.
The second is the American second half: how many of the approximately 200 GW "secured" before 4 July 2026 will actually become construction sites. This is the test of how well US solar stands without incentives.
The third is the majors' spending plans in their second-half 2026 financial statements: with Brent above 85 dollars, the question is not whether they will increase spending on hydrocarbons, but whether part of the additional cash will return to low-emission platforms or will all go into dividends and share buybacks. This will tell if the retreat from green was tactical or structural. Because the 2026 transition is neither the linear triumph of renewables nor their failure: it is a two-speed path within an energy security crisis, and for investors, the rule remains to distinguish narrative from numbers.
Sources: IEA, «World Energy Investment 2026» and press release of 28/05/2026; IEA, «World Energy Investment 2025»; IEA, «Electricity Mid-Year Update 2026» of 23/07/2026, reported by Radiocor–Borsa Italiana; Fortune and CNBC, 23/04/2026 (Hormuz); Trading Economics, 29/07/2026 (Brent); ANSA, 29/07/2026 (TTF); bp, Argus Media and Rigzone, 15/01/2026; Shell, first quarter 2026 and acquisition of ARC Resources; Wood Mackenzie, 03/03/2025 and 24/09/2025; Oil & Gas Journal, 01/04/2025 (Equinor and TotalEnergies); pv magazine, 24/07/2026, based on data from China's National Energy Administration; SEIA–Wood Mackenzie, «Solar Market Insight Q2 2026»; European Commission, AccelerateEU, 22/04/2026; stockanalysis.com, 28/07/2026 (XLE and ICLN). 2026 figures are IEA estimates and may be revised.
Disclaimer: the information provided in this article is for informational purposes only and does not constitute personalized financial advice in any way. It is recommended to consult a qualified professional before making any investment decisions.