
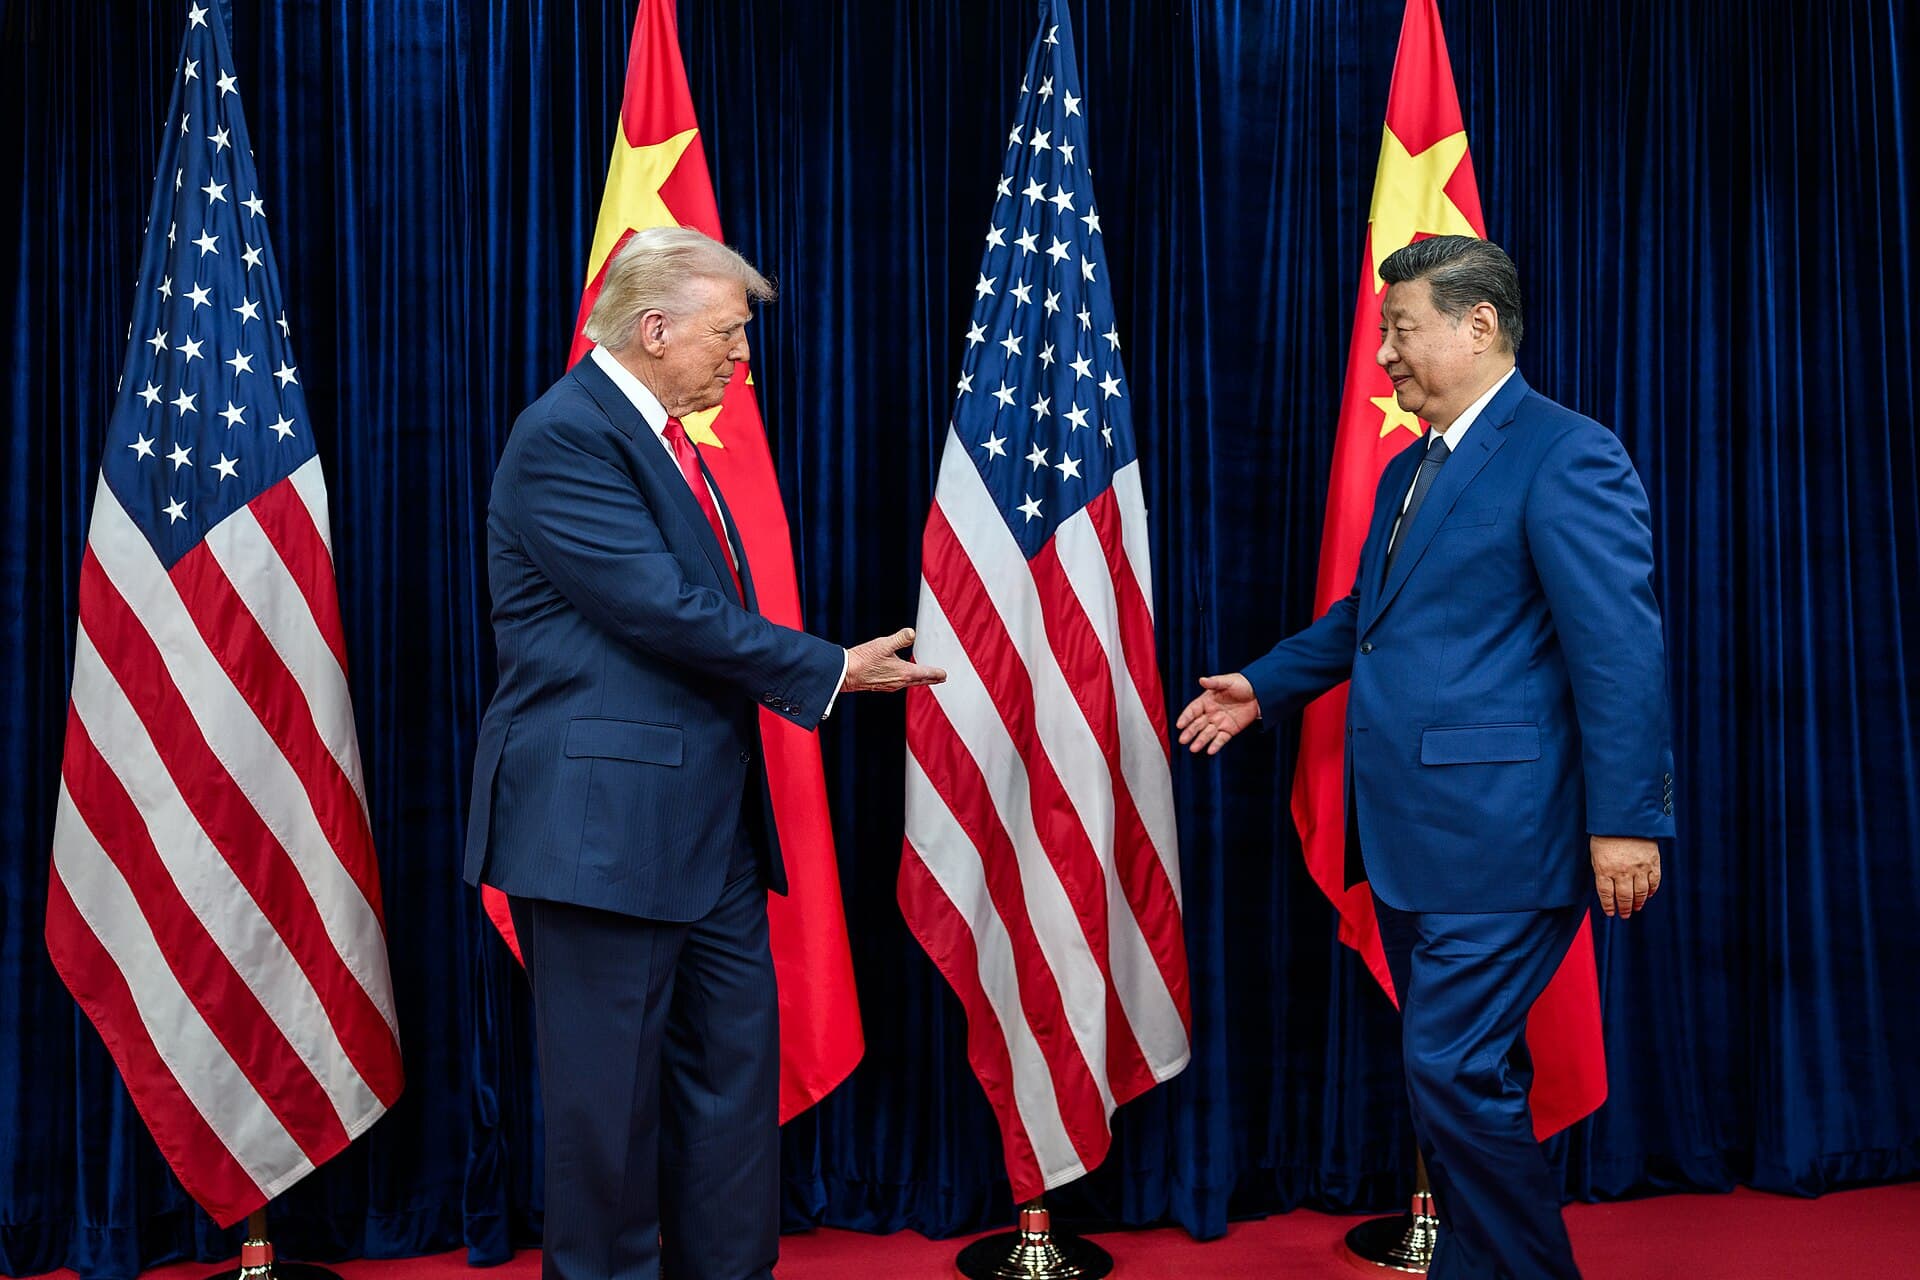


On Wednesday, August 12, 2026, before the opening of Wall Street, Goldman Sachs announced the acquisition of NEOS Investments for a consideration of up to 2.25 billion dollars in cash and stock. NEOS is a company founded in 2022 in Westport, Connecticut, which as of June 30, 2026, managed 30 billion dollars across nineteen ETFs built on systematic option strategies. The transaction is expected to close in the first quarter of 2027, subject to regulatory approvals.
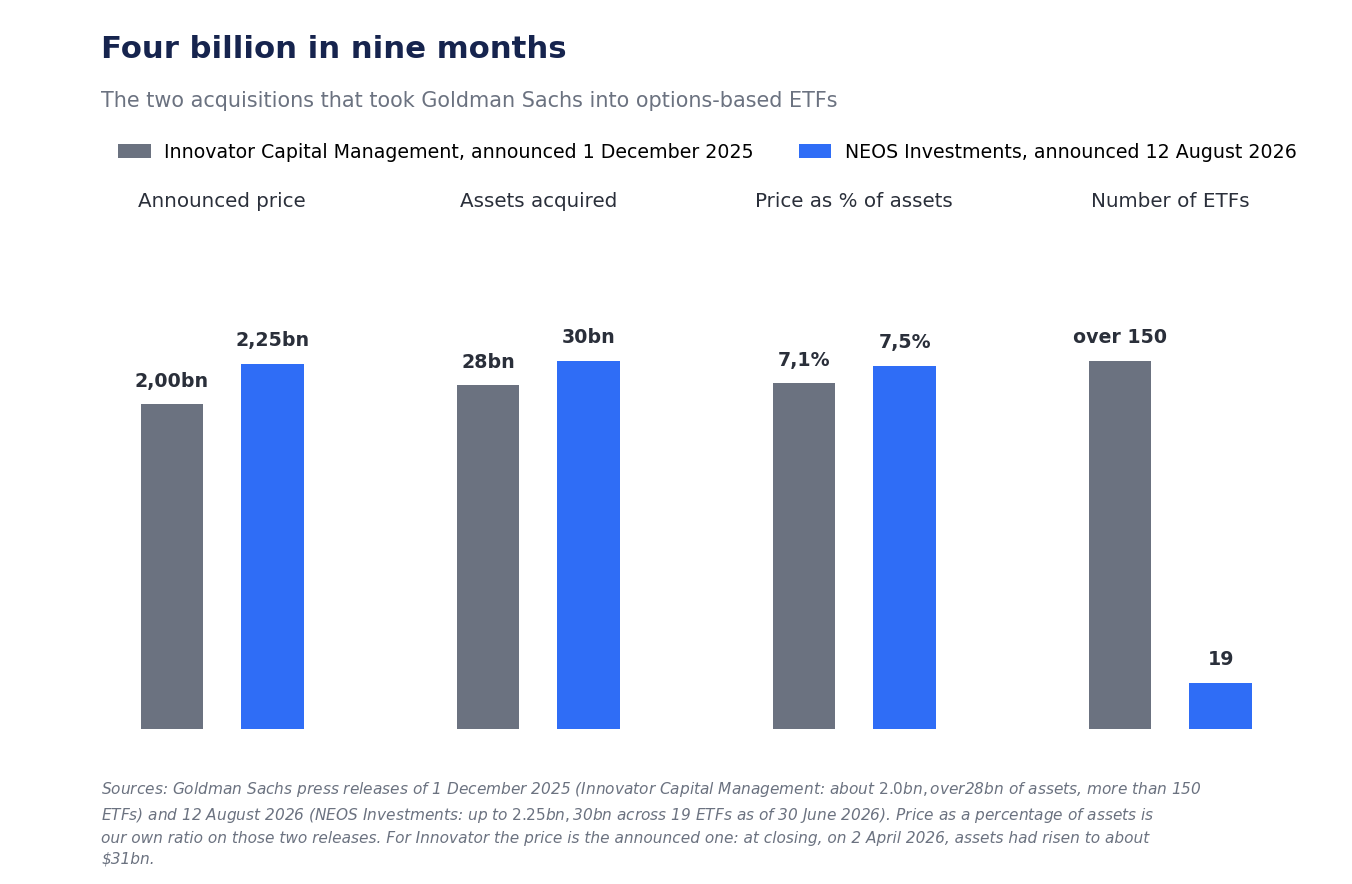
The number to keep in mind, however, is not the price: it is the ratio between the price and what is being bought. Goldman Sachs is paying 7.5% of the assets managed by NEOS. For a traditional asset manager, this would be an off-scale figure; for a firm that collects 0.68% per year on every dollar administered, compared to 0.03% for a passive S&P 500 ETF, the calculation changes. Upon completion of the transaction, Goldman Sachs Asset Management will reach over 130 billion dollars in ETF assets, of which 80 billion in actively managed products, and will become — based on Morningstar data as of June 30, 2026, cited by the bank — the eighth largest active ETF manager.
Two funds are the operation
The first thing to understand about NEOS is how concentrated it is. The company has nineteen products divided into five families — equity income, "enhanced" versions, alternatives on bitcoin, ether, gold, real estate and energy infrastructure, covered equity, enhanced fixed income — but only two funds account for 78% of the assets.
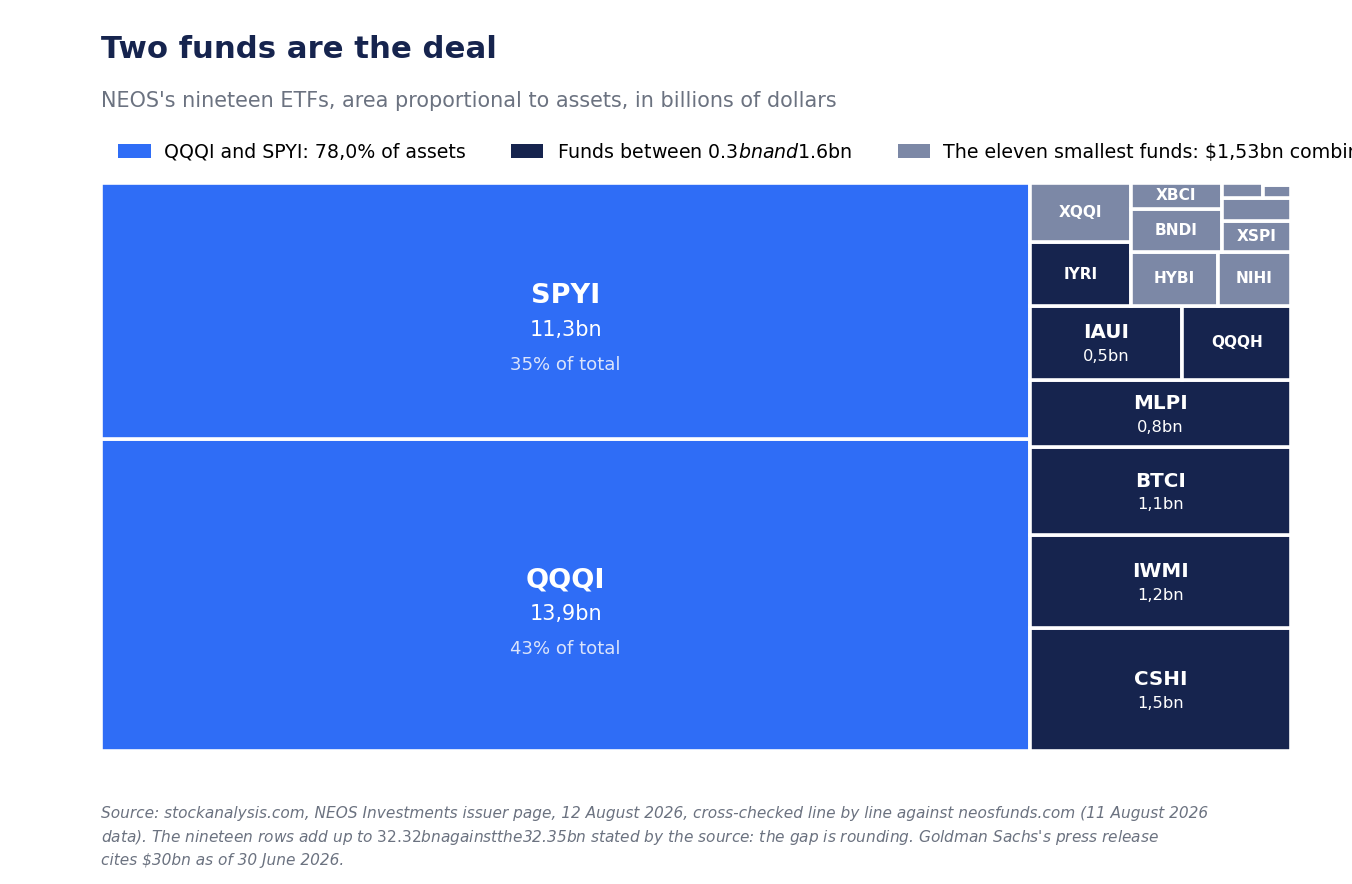
QQQI, the Nasdaq 100 fund, manages 13.87 billion dollars; SPYI, the S&P 500 fund, manages 11.35 billion (stockanalysis.com data as of August 12, 2026, consistent with those published by NEOS the day before). The third product, CSHI, which invests in very short-term Treasury bills, stops at 1.54 billion. The top three funds account for 82.8% of the total; the eleven smallest, combined, are worth 1.53 billion, or 4.7%. Between the figure in the press release (30 billion as of June 30) and that observed on the market on August 12 (32.3 billion), there are over two billion in six weeks: this is the combined effect of inflows and rising markets, but it gives a measure of the speed at which these products are growing.
It is worth noting that QQQI, launched in January 2024, is already the third largest ETF in the world in the derivative income category, behind only JPMorgan's JEPI and JEPQ, which manage 45.8 and 39.9 billion dollars respectively. Goldman Sachs, in other words, is not buying a niche player: it is buying numbers three and four in a market dominated by a single competitor.
How do these funds really work?
NEOS ETFs belong to the family that operators call derivative income. The mechanism, stripped of jargon, is simple: the fund buys a basket of shares that track an index — the S&P 500 for SPYI, the Nasdaq 100 for QQQI — and simultaneously sells on the options market the right to buy that index at a price higher than the current one. Whoever buys that right pays a premium. The premium collected is distributed monthly to subscribers.
The result is a very high monthly cash flow: as of August 12, 2026, the trailing twelve-month distribution yield reported by stockanalysis.com was 11.64% for SPYI and 13.77% for QQQI, compared to 1.03% for a passive S&P 500 ETF. But that premium is not money created from nothing: it is the price at which the fund has sold the upside of its potential gains. If the index rises little or falls, the strategy works well and cushions the blow; if the index runs, the fund lags because it has already sold that run.
Two technical details explain NEOS's commercial success compared to competing products. The first is that the company uses index options qualified in the United States as Section 1256 contracts, the outcome of which is taxed 60% as long-term capital gains and 40% as short-term capital gains: a real tax advantage for the American investor, which, however, does not transfer to residents elsewhere. The second is that a significant portion of the distributions is classified as return of capital, which defers taxation but also means that the subscriber, in those months, is partly getting their own money back. We add, for completeness, that these are ETFs listed in the United States: they are not normally distributable to retail investors in the European Union, because they lack the key information document required by PRIIPs regulations. For the Italian reader, this operation counts as an industry signal, not as a direct purchase opportunity.
More yield, less return: the true calculation
Here lies the point that the marketing of these products tends to leave in the background, and which deserves to be measured rather than described. Comparing the coupon of a distributing fund with that of a low-dividend ETF tells you nothing: you have to look at the total return, i.e., what someone who invested one hundred dollars at the start, reinvesting every distribution, would have in their pocket today.
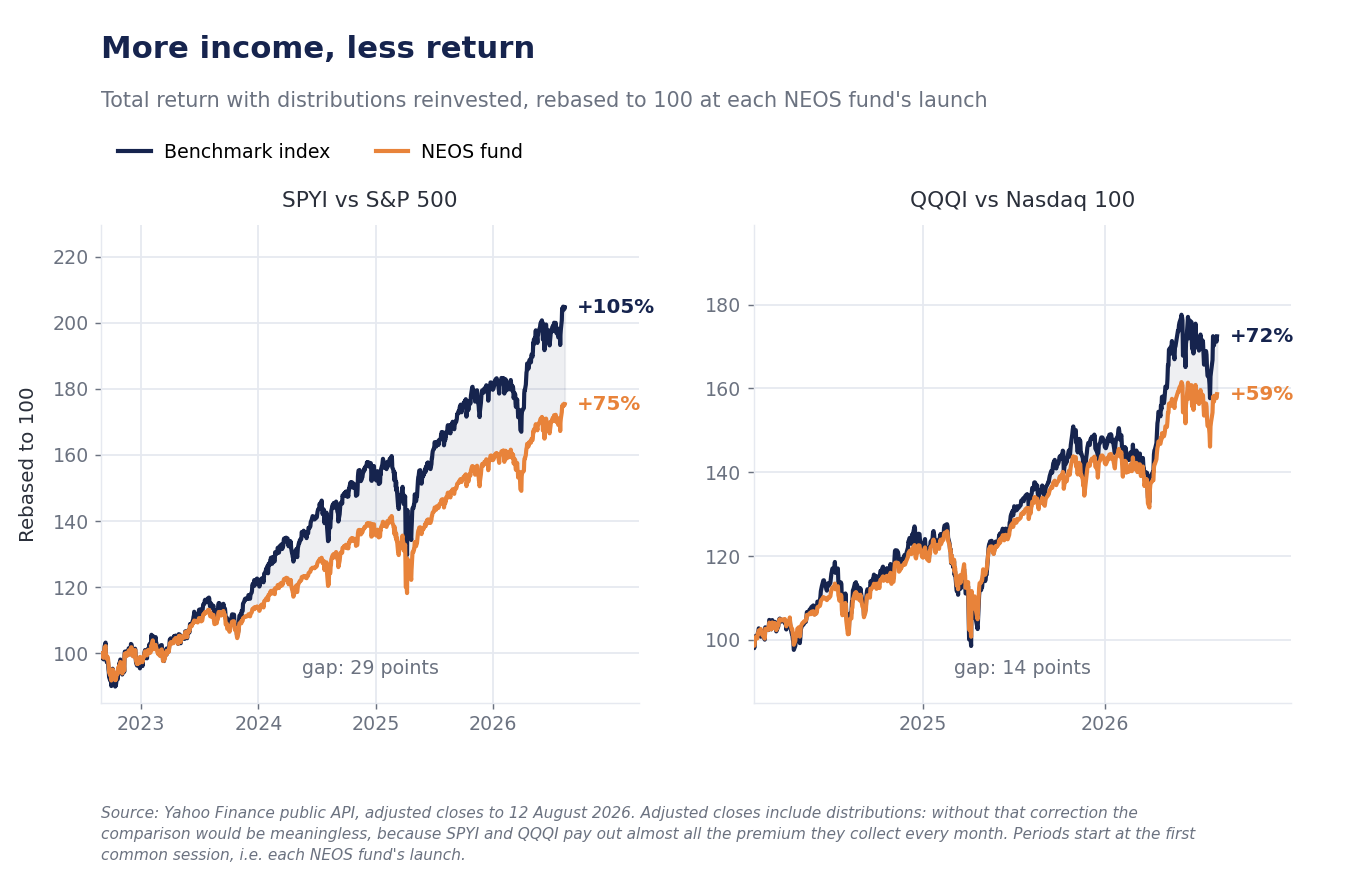
From August 30, 2022, its debut day, to August 12, 2026, SPYI produced a total return of 75%, compared to 105% for the S&P 500 ETF in the exact same interval: a 29-point difference, or 15.3% per year versus 19.9%. QQQI, since January 30, 2024, has yielded 59% compared to 72% for the Nasdaq 100: a 14-point difference, 20.0% per year versus 24.0%. Looking at the graph also shows when the gap forms: it widens in months of strong rallies and closes in corrections. In the deepest decline of the period, between February 19 and April 8, 2025, the S&P 500 lost 18.8% and SPYI 16.5%; the Nasdaq 100 22.8% and QQQI 20.0%. The promised protection is there, and it measures two to three points.
It is not a design flaw: it is exactly what the product promises to do. Those who buy it exchange potential return for certain cash flow and lower volatility. But this is information that changes how the acquisition is valued, because NEOS's assets grew in a strongly rising equity market, which is the least favorable scenario for the relative performance of these strategies. If subscribers have accepted to lag by four to five points a year in exchange for the coupon, they will hardly change their minds in a flat market, where the strategy performs best. This is an argument in favor of asset retention, not against it.
Why does Goldman pay 7.5% of assets?
In the asset management sector, acquisitions are traditionally valued as a percentage of assets acquired, and the usual range is a few percentage points. The 7.5% paid for NEOS is well above that range, and it is almost identical to the 7.1% paid in December for Innovator Capital Management. The reason lies in the unit margin, not in the size.
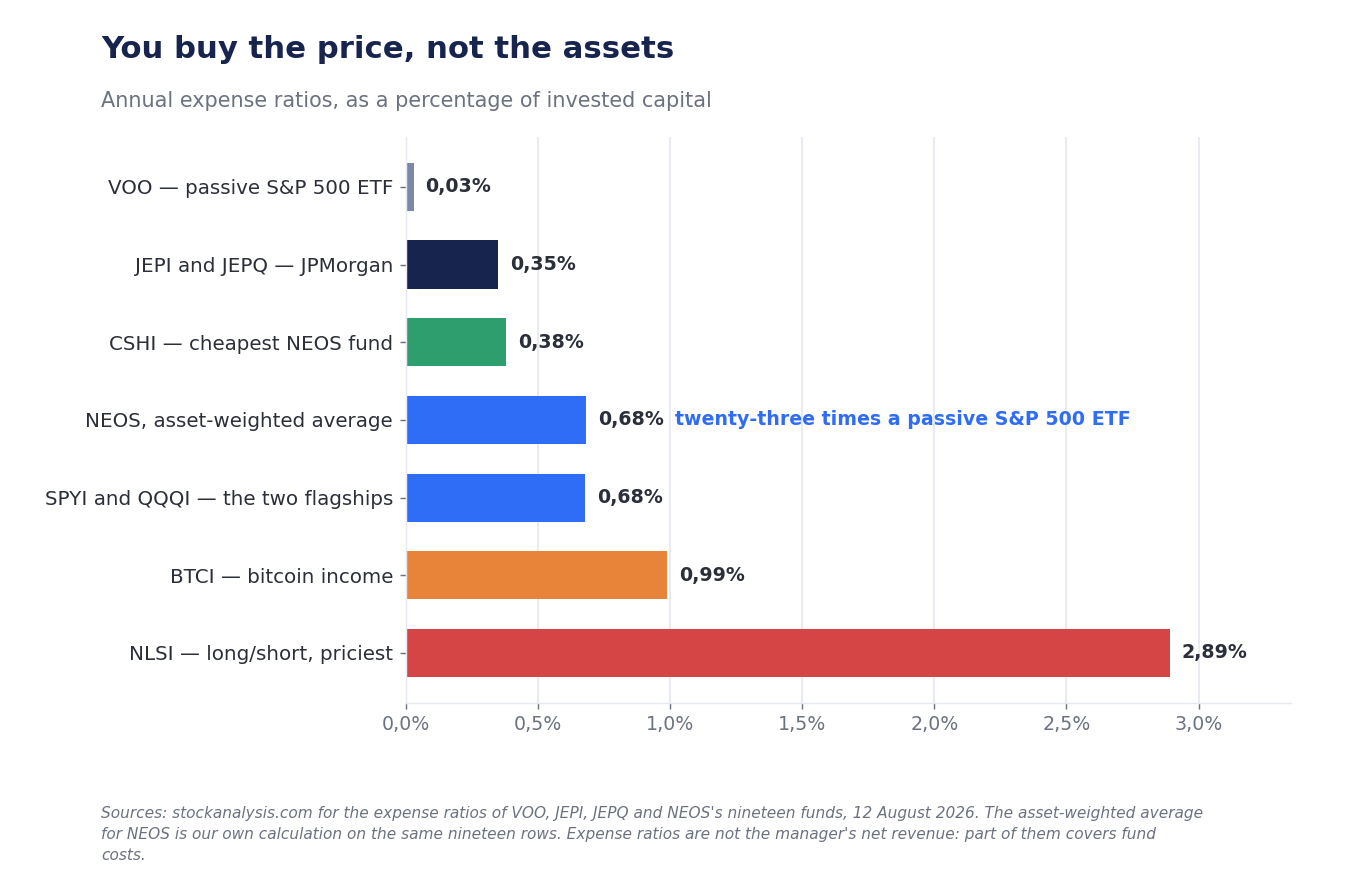
Applying each of the nineteen funds' current fees and weighting by assets, NEOS's average fee is 0.68% annually. On 32.3 billion in assets, this means approximately 220 million dollars per year in gross fees: the transaction price is therefore about ten times that flow. This is a rough calculation — the current fee is not the net revenue for the manager, because a portion covers fund costs — but it gives the correct order of magnitude and explains why a firm that manages four trillion dollars agrees to pay more than two billion for thirty.
The comparison with JPMorgan clarifies the other half of the reasoning: JEPI and JEPQ cost 0.35%, which is little more than half. NEOS charges double and still grows, and this is precisely the asset that Goldman is buying — the ability to charge an active management fee in a sector that has been moving towards zero cost for twenty years.
The strengths
The first is time. Building from scratch a range of option ETFs with a billion in monthly inflows requires years of track record and credibility with financial advisors; buying it requires a check. Goldman enters a mature segment with products that are already scaled, already rewarded, and already present on distribution platforms.
The second is the nature of the revenue. Management fees are recurring and predictable, the exact opposite of trading and advisory revenues from extraordinary transactions that historically drive Goldman Sachs's accounts. In the second quarter of 2026, the asset management division surpassed four trillion dollars in assets under management for the first time, with 230 billion in net inflows in that quarter alone: the strategic direction is declared and this acquisition executes it.
The third is complementarity with the previous acquisition. Innovator brings defined outcome ETFs, which limit maximum loss by forgoing part of the gain; NEOS brings those that transform volatility into monthly income. These are two different ways of selling the same need — a more predictable return — to two different types of clients. Together they form a range, not two products.
The fourth is the price structure. The consideration is "up to" 2.25 billion and is subject to the achievement of performance and retention targets: this means that a portion is paid only if assets remain and if the founders remain. Garrett Paolella and Troy Cates will become partners at Goldman Sachs. It is a structure that reduces the buyer's risk and aligns the seller's interests.
The weaknesses, and they are serious
Concentration. 78% of the value acquired is in two products that track two American equity indices with the exact same technique. It is not a diversified range: it is a doubled bet. If the option income trend cools down, or if a competitor launches the same product at half the price, almost everything moves together.
Dependence on volatility. The premium collected by selling options depends on how much the market fears future volatility. When expected volatility falls, premiums shrink and distributions with them. A fund that today promises 13% might promise 7% in a calm market environment, and the very reason investors bought it would disappear. This is a revenue risk that no acquisition contract can eliminate.
Relative return. A four-point annual lag on SPYI and four on QQQI is sustainable as long as the client considers it the price of the coupon. It becomes a reputation problem — and leads to outflows — if the comparison is highlighted in a market phase where the strategy offers no protection, for example, in a slow and prolonged downturn where premiums are not enough to offset capital losses.
The crypto tail. Among the nineteen funds, there are three linked to bitcoin and ether, totaling about 1.3 billion, and the largest of them shows a distribution yield exceeding 40%. These products bring a very different risk profile into Goldman Sachs — market, but especially regulatory and reputational — from that of an S&P 500 ETF. They represent a small fraction of the assets and a disproportionate fraction of the questions the board of directors will receive.
People risk. NEOS is four years old and has two founders. The value acquired is largely their ability to launch products that gather assets: the earn-out explicitly recognizes this. The integration of boutiques into large banks has a long and not always happy history, and the risk is not technical, it is cultural.
Nine months, four billion, one strategy
This is the second acquisition of an ETF issuer that Goldman Sachs has announced in nine months. On December 1, 2025, it agreed to acquire Innovator Capital Management, a pioneer of defined outcome ETFs, for approximately two billion dollars for over 28 billion in assets and more than one hundred and fifty funds; the transaction closed on April 2, 2026, when reported assets had risen to approximately 31 billion across 171 products, bringing Goldman Sachs Asset Management's total ETF range to approximately 240 ETFs worldwide.
Lined up, the two operations tell a clear industrial choice: Goldman decided that in the outcome-oriented ETF market, it made no sense to build, so it bought. The context explains it. According to ETFGI, assets in actively managed ETFs reached a record 2.33 trillion dollars globally at the end of April 2026, with 311.66 billion in net inflows year-to-date, an all-time high; in the United States, active ETFs have surpassed 1.5 trillion dollars, account for about 39% of flows, and represent 80% of new launches. Within this market, the derivative income segment has grown at a compound annual rate of over 70% since 2021, according to Morningstar data cited by specialized press.
However, there is a structural fact that must be stated: that segment is already highly concentrated. Adding JPMorgan's JEPI and JEPQ (85.7 billion) to NEOS's equity funds (approximately 27 billion) brings the total to just under three quarters of an equity category that exceeded 150 billion in January 2026. Goldman is not entering a fragmented market to consolidate: it is buying second place in a de facto duopoly.
What the market said
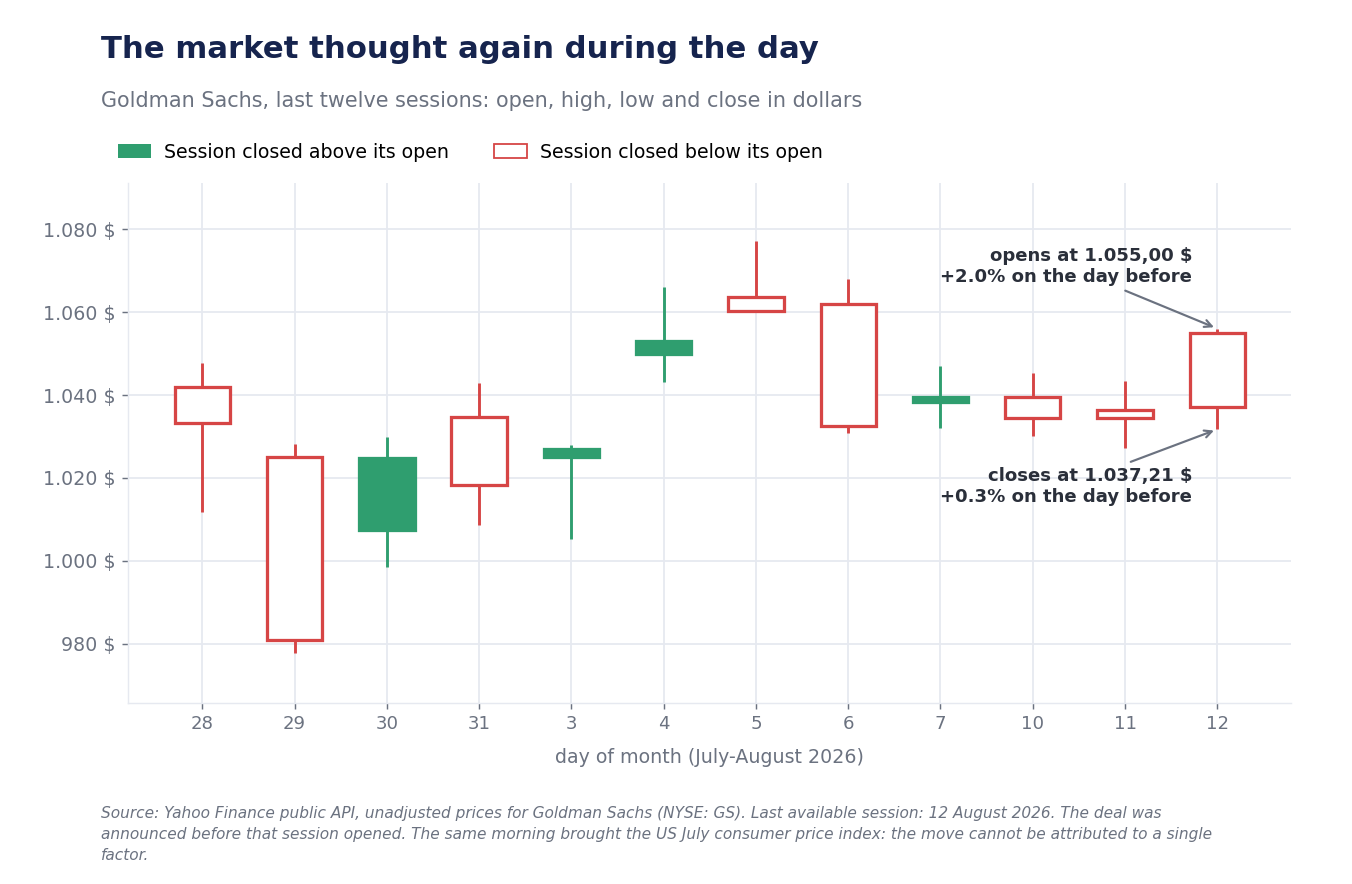
Goldman Sachs stock opened the August 12 session at 1,055.00 dollars, 2.0% above the previous day's close, touched a high of 1,056.05, and then gave back almost all of it, closing at 1,037.21 dollars, up 0.27%. The most honest reading is that the market approved the direction without attributing immediate value: 2.25 billion is 0.7% of the bank's 314 billion capitalization at that close, the transaction will be finalized in two quarters, and the contribution to earnings will come in 2027.
It should be added that on the same morning, the American market received the July consumer price index, one of the most closely watched macroeconomic data of the year. Attributing the stock's movement solely to the acquisition would be incorrect: these are two events in the same session, and the second moves the entire banking sector.
What to watch from here until closing
Three indicators will tell if the price was right, and all are public. The first is the monthly inflows for QQQI and SPYI: as long as they continue to attract capital, the thesis holds; a series of months in outflow, even before closing, would trigger performance clauses and reduce the effective consideration. The second is the level of distributions: a decline in declared distribution rates would signal the compression of option premiums before it appears in financial statements. The third is the response of competitors: JPMorgan defends a dominant position with a product that costs half as much, and a cut in its fees would be the simplest move to put pressure on the newly acquired margin.
On the calendar is Goldman Sachs's third-quarter earnings report, expected in October, which will update ETF assets and the asset management division's inflows, and then the first quarter of 2027 indicated by the bank for the completion of the transaction. Until then, NEOS remains an independent company and its funds continue to be managed as they are today.
Sources
Terms of the transaction, NEOS's assets and number of ETFs, Goldman Sachs Asset Management's ETF assets, position in the ranking of active ETF managers, financial and legal advisors, expected closing date, and founders' names from the Goldman Sachs press release of August 12, 2026, reproduced and supplemented by Bloomberg, Banking Dive, and Yahoo Finance. Previous acquisition of Innovator Capital Management from Goldman Sachs press releases of December 1, 2025 (announcement) and April 2, 2026 (completion) and from CNBC reporting. Assets, current fees, and distribution rates of the nineteen NEOS funds from stockanalysis.com (data as of August 12, 2026), cross-referenced line by line with the official website neosfunds.com (data as of August 11, 2026): the two sources coincide for the main funds and the sum of the nineteen items, 32.32 billion, corresponds to the declared 32.35 less rounding. JEPI, JEPQ, and VOO fees and ranking of the derivative income category from stockanalysis.com and financecharts.com (data as of August 7 and 12, 2026). Total returns for SPYI, QQQI, SPY, and QQQ calculated by the editorial team based on adjusted closes from Yahoo Finance's public API, which incorporate distributions, over periods aligned with the first common trading session. Opening, high, low, and closing prices of Goldman Sachs stock from the same source. Size and growth of the actively managed ETF market from ETFGI press releases of May 2026; growth of the derivative income segment from Morningstar data cited by Banking Dive and ETF Trends. The weighted average fee by assets, the ratio between price and gross fees, the price as a percentage of assets, and the concentration shares are elaborations by the editorial team based on figures from the cited sources; they are indicated as such in the text because they do not appear in any official document.
This article is for informational purposes only and does not constitute financial advice, investment research, a public offering, or a personalized recommendation to buy or sell. The assessments expressed are opinions of the editorial team based on public data as of the publication date and may change without notice. The value of investments can decrease as well as increase, and past performance is not indicative of future returns. Before any investment decision, it is advisable to consult a qualified financial advisor and evaluate the consistency of the operation with one's objectives, time horizon, and risk tolerance.