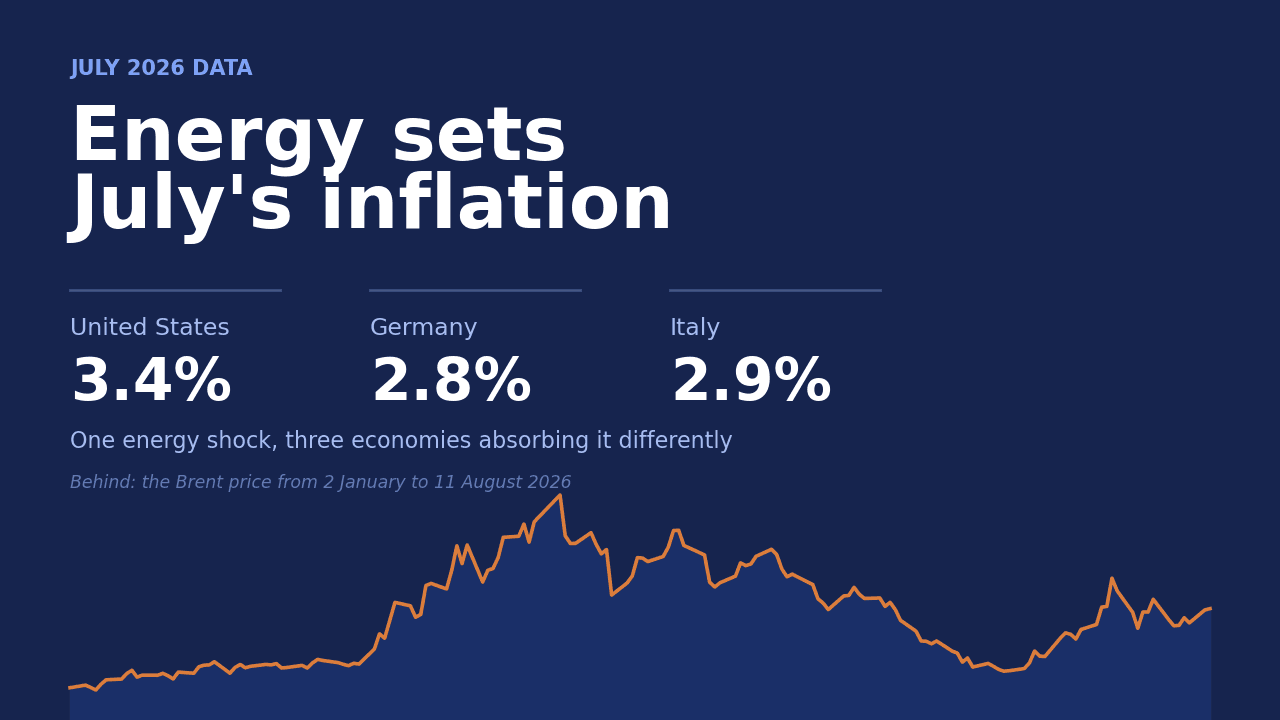

On Wednesday, August 12, 2026, the Bureau of Labor Statistics announced that US consumer prices rose by 0.1% in July and by 3.4% over the twelve months, exactly as expected; on the same morning, Destatis confirmed German inflation at 2.8%, and Istat revised Italy's inflation upwards, from a preliminary 2.8% to a definitive 2.9%. Three different numbers stemming from the same fact: the price of crude oil.
Brent, which was worth 61.98 dollars per barrel on January 2, reached 138.21 dollars on April 7 with the war between the United States, Israel, and Iran and the closure of the Strait of Hormuz. It then fell back to 68.53 dollars on July 2 when a ship transit agreement seemed close, and on August 11, it was again at 93.26 dollars. Each economy translated that same oscillation into its own inflation, depending on how much energy weighs in the basket, how tariffs are regulated, and how much domestic demand absorbs the price increase. This is why three almost identical percentages tell three very different stories.
One shock, three ways to absorb it
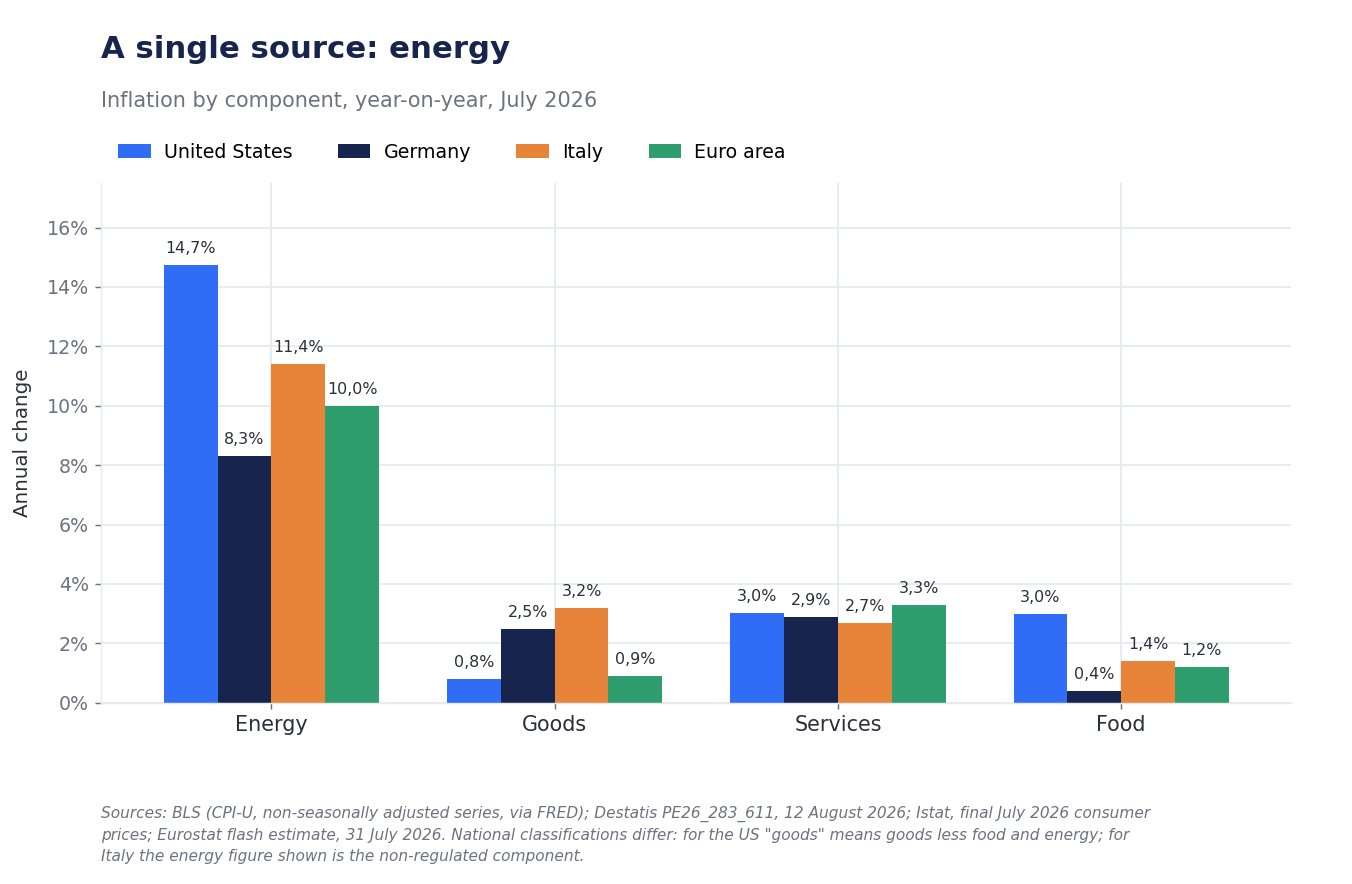
The overall picture is this. The euro area closed July with harmonized inflation at 2.9% according to Eurostat's flash estimate of July 31, up from 2.8% in June: the energy component rose from 8.5% to 10.0% annually, while food, alcohol, and tobacco slowed from 1.5% to 1.2%. Excluding energy, the area settles at 2.2%. In the United States, energy is still rising faster, at 14.7% annually, but the rest of the basket is calmer: goods excluding food and energy rose by just 0.8%.
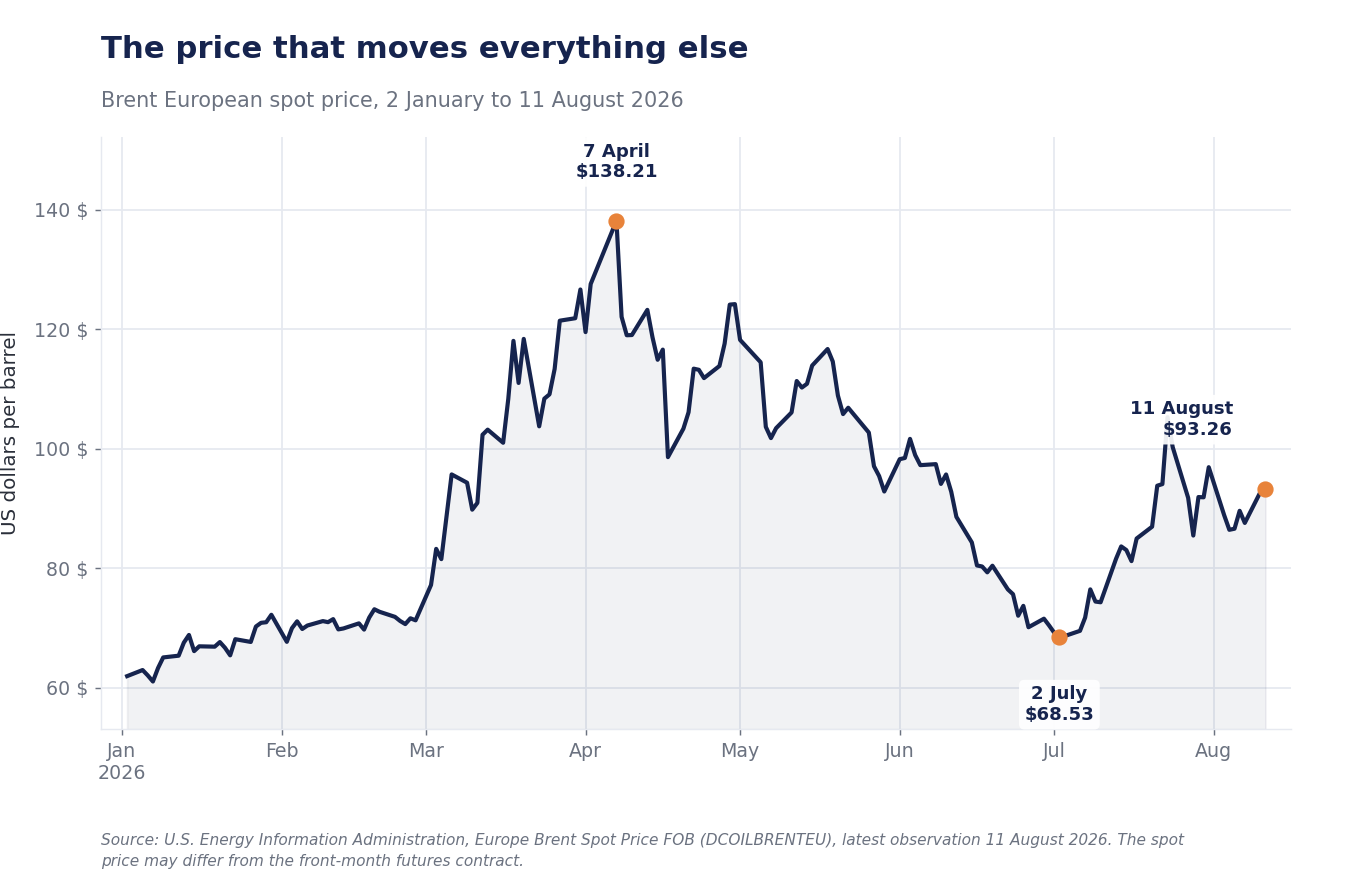
This is the point that makes July's data less reassuring than it seems: the survey captures a month in which Brent traded at an average of 83.76 dollars, compared to 71.04 dollars in July 2025. In the first decade of August, the price is already ten dollars higher. Istat itself, in the methodological note of the release, indicates that fuels decelerated in the first part of July and accelerated in the second, coinciding with the resumption of the conflict between the United States and Iran.
United States: the reassuring data and the one that doesn't add up
The US Consumer Price Index (CPI) measures the cost of a fixed basket of goods and services purchased by urban households. In July, it rose by 0.1% month-over-month, after a 0.4% decline in June, and by 3.4% over the twelve months, from 3.5% in June: the consensus gathered by Dow Jones indicated exactly these values. The core component, which excludes food and energy because they are the most volatile items and less linked to the domestic cycle, grew by 0.2% month-over-month after remaining flat in June, bringing the annual rate from 2.6% to 2.5%.
Composition matters more than the headline figure. About two-thirds of the monthly increase came from the housing component (shelter), which accounts for over a third of the index and includes actual rents and owners' equivalent rent: it rose by only 0.1% month-over-month and 3.2% year-over-year. Energy, however, subtracted from inflation in the month, with a 1.5% decline, but remained at +14.7% year-over-year (it was +15.7% in June), with gasoline at +24.6%. Goods excluding food and energy settled at +0.8% annually; services excluding energy slowed from 3.2% to 3.0%.
However, there is an element that the CPI headline does not convey and that matters a great deal to the Federal Reserve: the American central bank's target is not the CPI, but the Personal Consumption Expenditures (PCE) deflator, constructed by the Bureau of Economic Analysis on a broader basis — it includes, for example, healthcare paid by employers and public programs — and with weights that update as consumption changes. In June, the last available month, core PCE grew by 3.3% annually and overall PCE by 3.7%. Between the 2.5% of core CPI and the 3.3% of core PCE, there are almost eight tenths of a point: those who only read the first conclude that American inflation has almost retreated, while those who look at the second see a measure still far from 2%. The two indices are not interchangeable. July's PCE is released on August 26.
The labor market is cooling, and the revision shows it
On Friday, August 7, the employment report surprised negatively: non-farm payrolls decreased by 23 thousand units, against expectations ranging from 83 to 95 thousand jobs depending on the survey. Even more significant were the revisions: May was cut by 66 thousand jobs to +63 thousand, and June by 37 thousand to +20 thousand, for a total of 103 thousand fewer jobs than believed a month ago. The three-month average thus falls to about 20 thousand jobs, compared to an average of 34 thousand in the last twelve. Losses were concentrated in local government education (-50 thousand) and retail trade (-19 thousand).
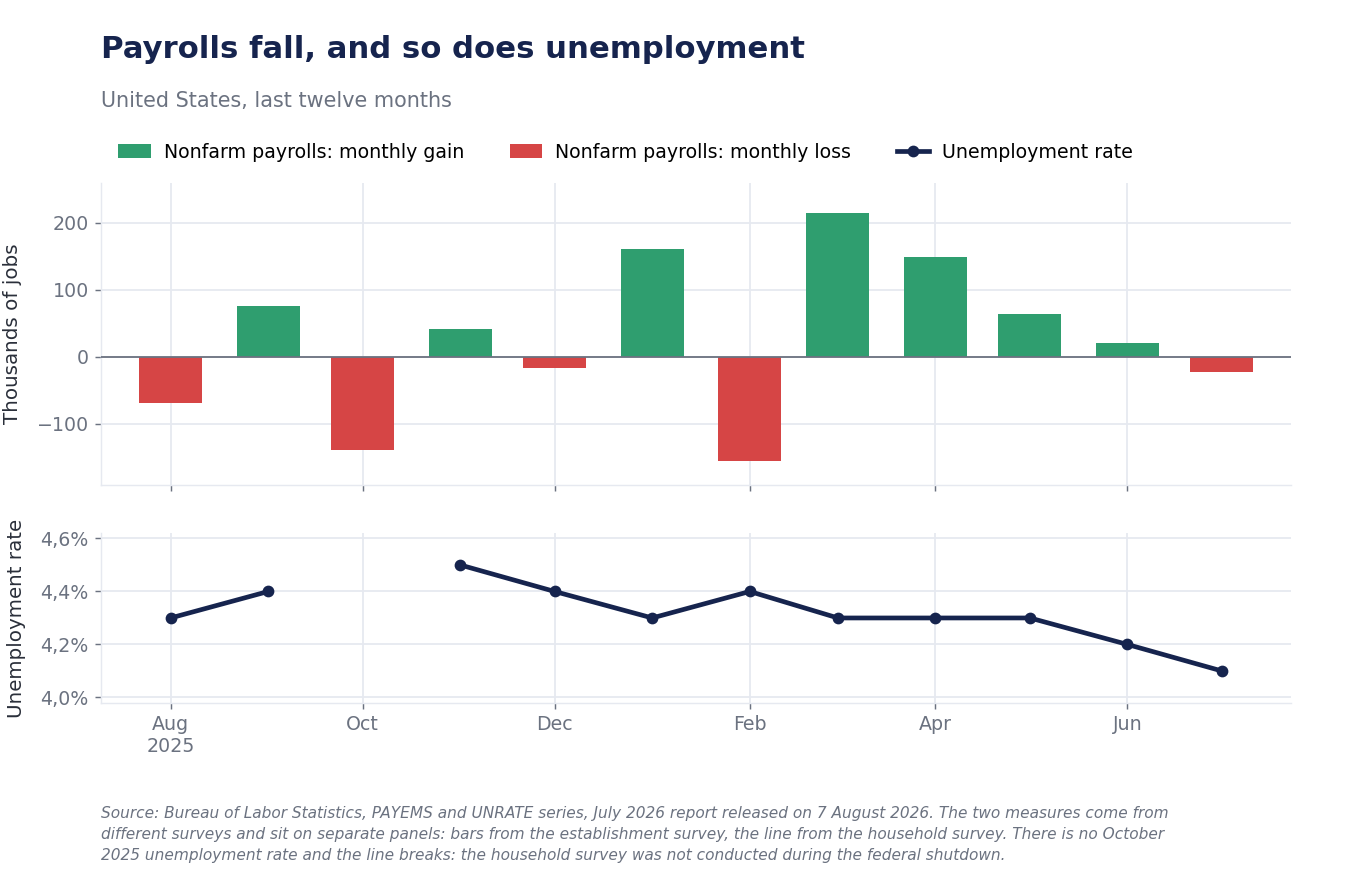
However, the unemployment rate fell from 4.2% to 4.1%. This is an apparent contradiction explained by the second survey: the labor force participation rate — the share of the working-age population that is employed or actively seeking employment — fell to 61.4%, the lowest level in over five years. When people stop looking for work, they exit the unemployment calculation, and the rate improves without employment improving. Confirmation comes from wages: average hourly earnings increased by two cents, bringing annual growth to 3.2% from 3.4%, against expectations of 3.5% and at the slowest pace since May 2021. A tight labor market does not produce such numbers.
Second-quarter gross domestic product, released by the BEA on July 30, grew by 1.5% annualized, below the 2.1% estimated by economists polled by LSEG and below the 1.8% from the Wall Street Journal survey, and slowing from 2.1% in the first quarter. Within that data, however, there is a sharp acceleration in private consumption, +3.2% annualized against +0.5% in the previous three months: holding back growth were contracting government spending and decelerating investments and exports. In short, American household demand is still holding up — and this is precisely what makes it difficult for the Fed to declare victory on prices.
Germany: inflation rises by decree, not by demand
Destatis confirmed on August 12 that the German national consumer price index rose by 2.8% year-over-year in July, from 2.3% in June and 2.6% in May, with a jump of 0.8% in the single month; the harmonized European index (HICP), which uses common methodology and baskets to make countries comparable, also recorded +2.8% year-over-year. The preliminary estimate of July 30 had already indicated 2.8% against expectations of 2.7%.
The acceleration has an almost entirely identifiable origin: fuels rose by 23.0% on an annual basis after the end of the government discount on June 30, 2026. The rest of domestic energy, however, is falling — electricity -5.3%, gas -2.9% — while heating oil recorded +34.7%; total energy products grew by 8.3%. Excluding energy, the picture is mild: food just +0.4%, goods +2.5%, services +2.9%, core inflation at 2.4%. Germany does not have an overheated demand problem: it has a fiscal and oil price increase passing through the pump.
The economic cycle, meanwhile, is less weak than previously reported. In the second quarter, GDP grew by 0.2% quarter-over-quarter, above the expected +0.1%, after a first quarter revised upwards to +0.4%; year-over-year growth is 0.9%. On the same occasion, Destatis revised recent history: 2024, previously estimated to contract by 0.5%, now shows stagnation (0.0%). The components remain imbalanced: exports increasing, final consumption sluggish, investments decreasing.
Industry shows mixed signals. Industrial production in June rose by 0.2% month-over-month, but excluding energy and construction, it remained unchanged; manufacturing orders jumped by 3.1%, only to fall by 0.5% when large orders were excluded: the rebound is concentrated in a few contracts. Foreign trade shows record exports — 139.3 billion euros, +6.6% year-over-year — but a sharply reduced surplus, from 19.1 to 15.4 billion, because imports grew much faster (+8.4% year-over-year): this is the mechanical effect of a more expensive energy bill, confirmed by import prices rising 6.1% annually against 3.5% for exports.
The German labor market remains the real sore point. In July, the unemployed exceeded three million (3.007 million, +71 thousand month-over-month and +28 thousand year-over-year) and the rate rose by two tenths to 6.4%. The Federal Employment Agency attributes the increase mainly to summer vacation seasonality, but notes that the weakness of recent months continues: employed persons decreased by 23 thousand units in June, and reported job vacancies are 653 thousand. Germany accounts for just under a third of the euro area's output: when its industry does not recover, the ECB's monetary policy finds itself fighting imported inflation in an economy that does not generate internal price pressure.
Italy: inflation falls, purchasing power too
Istat released the definitive July data on August 12: the Italian national consumer price index for the entire community (NIC) rose by 0.3% month-over-month and by 2.9% year-over-year, from 3.0% in June. This is an upward revision compared to the preliminary estimate of 2.8% on July 31: a tenth worth noting, because it goes in the opposite direction to that suggested by the headline "inflation falling." The harmonized HICP index recorded -1.0% month-over-month, due to summer sales which the NIC does not account for, and +2.9% year-over-year. The FOI index, used for contractual and rent revaluations, is at +2.8%.
The slowdown is entirely in the volatile components: non-regulated energy from +13.3% to +11.4%, unprocessed food from +4.4% to +3.6%, various services from +2.5% to +1.8%. Moving in the opposite direction are regulated energy products — those with administered tariffs — which accelerated from +9.2% to +14.8% with a jump of 6.5% in the single month, transport services, and recreational and cultural services. Core inflation, net of energy and fresh food, remained at 1.6%; goods decelerated from +3.3% to +3.2%, services accelerated from +2.6% to +2.7%. The "shopping cart" slowed from 1.3% to 1.0%. Acquired inflation for 2026 — that which would be recorded if prices remained stable until December — is 2.7% for the general index and 1.8% for the core component.
In terms of expenditure division contributions, the largest weight comes from housing, water, electricity, and fuels (0.878 percentage points) and transport (0.650): together, more than half of Italian inflation. It's the same energy story, seen from the perspective of utility bills and fuel tank filling.
The consequence on the real economy is the most important data of the Italian week, released on July 29. In the second quarter, contractual hourly wages grew by 2.5% (+2.3% in the private sector, +2.7% in public administration) against inflation of 3.0%: after ten consecutive quarters of growth exceeding prices, purchasing power is declining again. At the end of June, 50 national contracts covering 69.9% of employees were in force for the economic part, and approximately 3.9 million workers were awaiting renewal: a significant portion of wages is, by definition, stagnant while prices rise.
The rest of the Italian data describes an economy that grows little but does not recede. Second-quarter GDP, a preliminary estimate from July 30, rose by 0.2% quarter-over-quarter and 1.0% year-over-year, above consensus (+0.1% and +0.7%) but slightly slowing from +0.3% in the first quarter; acquired growth for 2026 rose to 0.8%. Within the data, services increased against a decline in agriculture and industry, with a positive contribution from domestic demand and a negative contribution from net foreign demand. Consistently, industrial production in June fell by 1.0% month-over-month and 0.6% year-over-year adjusted for working days, although the second-quarter average remained up 0.4% from the first. Retail sales in June fell by 0.1%, but year-over-year they grew by 3.1% in value and 1.9% in volume — households are still buying a little more merchandise, not just more expensive merchandise. Confidence improved in July for both consumers (from 92.4 to 94.2) and businesses (from 95.3 to 95.6).
The labor market, however, sharply deteriorated. In June, employed persons remained stable at 24.3 million and the employment rate held at 62.9%, but unemployed persons increased by 97 thousand units (+7.2%) and the unemployment rate rose by four tenths to 5.7%, with youth unemployment at 18.4%. The movement is largely accounting-based — inactive persons aged 15-64 fell by 103 thousand units, i.e., people who returned to seeking work and thus moved from inactive to unemployed — but the fact remains that employment stopped growing: year-over-year, the balance is still positive by 131 thousand units (+0.5%).
The comparison must be made using the same units of measurement
The most common way to get this comparison wrong is to line up "United States +1.5%, Germany +0.2%, Italy +0.2%" and conclude that America is growing seven times faster than Europe. This is not the case: the BEA publishes quarterly GDP annualized, meaning the pace that would be achieved if that quarter repeated for an entire year, while Destatis, Istat, and Eurostat publish the change from the previous quarter. On the same basis, the American second quarter is worth +0.4%, compared to +0.2% for Germany and Italy and +0.4% for the euro area. The gap exists, but it is two tenths of a point, not an order of magnitude.
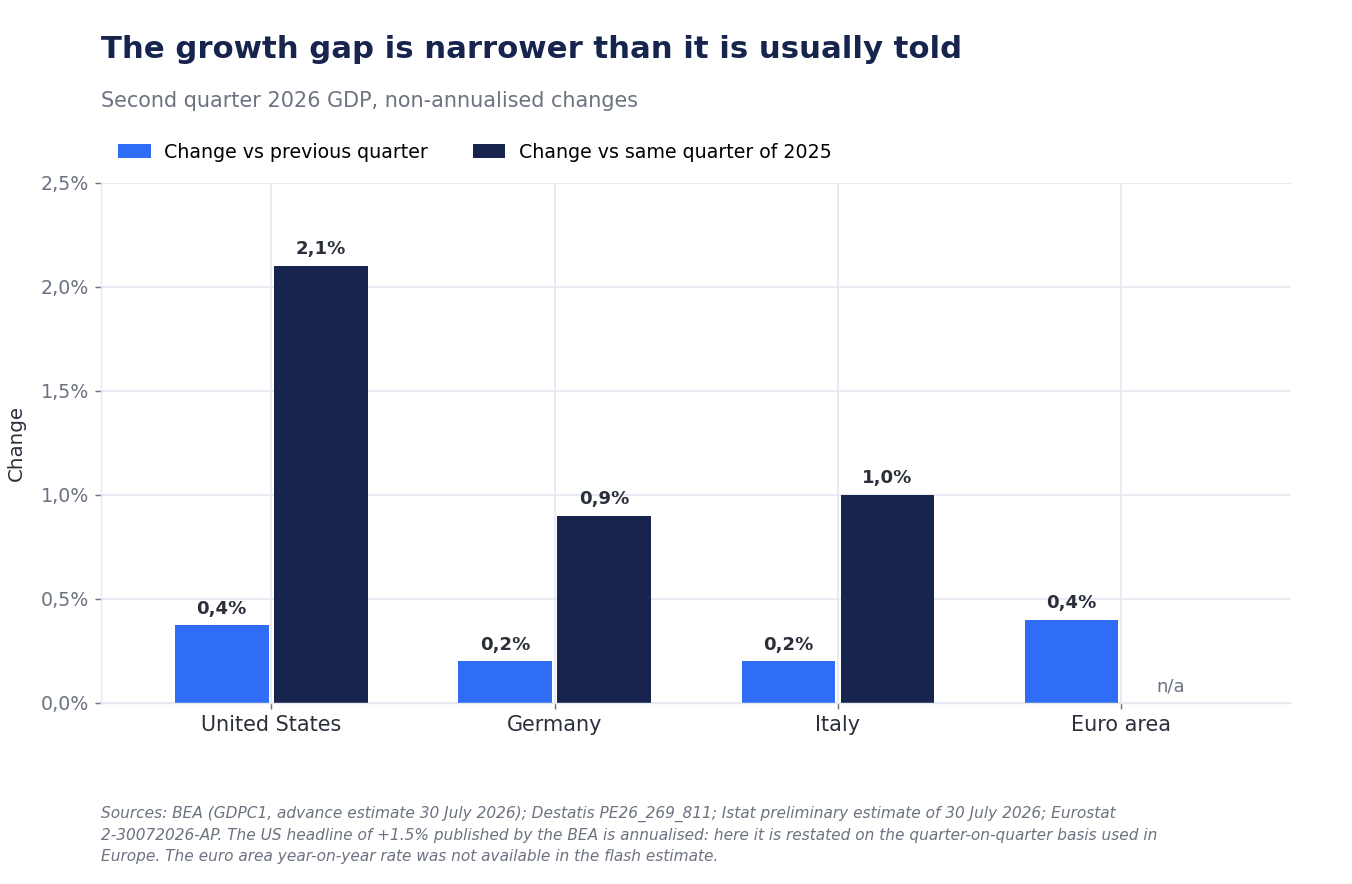
On the annual data, the distance is real: +2.1% in the United States against +1.0% in Italy and +0.9% in Germany. But the structural difference matters more than the number. In the United States, inflation is the highest of the three (3.4%), it is almost all energy, and domestic demand is strong: the risk is that the shock will transmit to wages and become permanent. In Germany, it is the lowest (2.8%) and stems from the end of a subsidy, so it will naturally exit the annual comparison in twelve months, but it comes to an economy with three million unemployed and a stagnant industry. In Italy, core inflation is the lowest overall (1.6% against 2.4% German and 2.5% US, with non-identical definitions: Istat excludes energy and fresh food, BLS and Destatis all food), a sign that pressure does not stem from domestic demand; but contractual wages are growing less than prices, and this compresses consumption precisely while GDP is already at +0.2% per quarter.
The same change in the index, in short, has opposite meanings: one tenth more inflation in the United States is a monetary policy problem, one tenth more in Italy is a problem of household purchasing power.
| Country | Indicator | Current | Previous | Consensus | Source, date |
|---|---|---|---|---|---|
| United States | CPI, annual change (July) | +3.4% | +3.5% | +3.4% | BLS, Aug 12 |
| United States | Core CPI, annual change (July) | +2.5% | +2.6% | n.d. | BLS, Aug 12 |
| United States | Core PCE, annual change (June) | +3.3% | +3.4% | n.d. | BEA, Jul 31 |
| United States | Non-farm payrolls (July) | −23,000 | +20,000 (revised from +57,000) | +83/+95,000 | BLS, Aug 7 |
| United States | Hourly wages, annual change (July) | +3.2% | +3.4% | +3.5% | BLS, Aug 7 |
| United States | Q2 GDP, annualized | +1.5% | +2.1% | +2.1% (LSEG) | BEA, Jul 30 |
| Germany | CPI, annual change (July) | +2.8% | +2.3% | +2.7% | Destatis, Aug 12 |
| Germany | Core inflation (July) | +2.4% | n.d. | n.d. | Destatis, Aug 12 |
| Germany | Q2 GDP, quarter-over-quarter | +0.2% | +0.4% (revised from +0.3%) | +0.1% | Destatis, Jul 30 |
| Germany | Unemployed (July) | 3.007 mln | 2.936 mln | n.d. | Fed. Emp. Ag., Jul 31 |
| Italy | NIC, annual change (July) | +2.9% | +3.0% | +2.8% (prelim.) | Istat, Aug 12 |
| Italy | Core inflation (July) | +1.6% | +1.6% | n.d. | Istat, Aug 12 |
| Italy | Q2 GDP, quarter-over-quarter | +0.2% | +0.3% | +0.1% | Istat, Jul 30 |
| Italy | Unemployment (June) | 5.7% | 5.3% | n.d. | Istat, Jul 30 |
| Euro area | HICP, annual change (July) | +2.9% | +2.8% | n.d. | Eurostat, Jul 31 |
| Euro area | Q2 GDP, quarter-over-quarter | +0.4% | n.d. | n.d. | Eurostat, Jul 30 |
Fed and ECB: same problem, opposite constraints
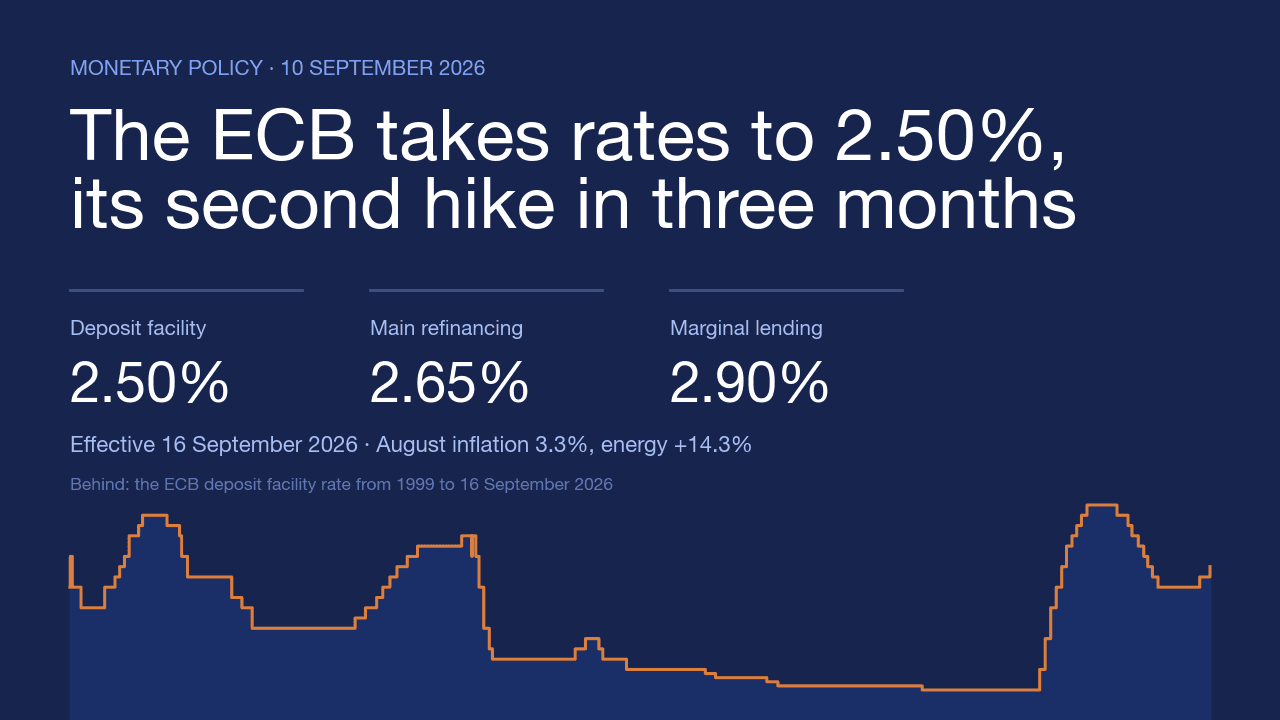
What has been decided. On July 29, the FOMC left the federal funds rate between 3.50% and 3.75% with a 9-3 vote: Beth Hammack, Neel Kashkari, and Lorie Logan would have preferred a 25 basis point hike. The statement describes robust expanding activity, high uncertainty also linked to the Middle East conflict, and inflation still above the 2% target. The ECB on June 11 had raised the three key interest rates by 25 basis points — the first hike since 2023 — bringing the deposit rate to 2.25%, the main refinancing operations rate to 2.40%, and the marginal lending facility rate to 2.65%, justifying it with inflationary pressures from the conflict; on July 23, it left everything unchanged unanimously. In its June projections, the Eurosystem estimated inflation at 3.0% in 2026, 2.3% in 2027, and 2.0% in 2028, with growth at 0.8% this year. Christine Lagarde indicated that the inflationary impact of the energy shock has not yet fully unfolded and that the Governing Council is monitoring its intensity, duration, and second-round effects, while core inflation remains contained and wage expectations moderate.
What the market prices in. The implied probabilities of a Fed hike at the September 15-16 meeting were close to even before the CPI. After the data, readings diverge: according to the CME FedWatch tool, CNBC reports, the probability fell to 42%, while Reuters, citing federal funds futures, indicates it as stable at 55%. The message is nevertheless the same — September is a coin toss — and it is an anomaly that the uncertainty concerns the direction of a hike, not a cut. Fed officials' projections for year-end oscillate between 3.6% and 4.1%. The ECB decides on September 10, with new projections.
What is analysis. The week's data make a September Fed hike more difficult: inflation in line with expectations, wages at the slowest pace in five years, and 103 thousand jobs canceled by revisions are not the combination that pushes a central bank to tighten. Counteracting this are core PCE at 3.3%, accelerating household demand, and oil at its highest since mid-June. For the ECB, the problem is symmetrical but with opposite constraints: euro area inflation rises to 2.9% almost entirely due to energy, Italian core inflation at 1.6% indicates very weak internal pressure, and Germany has three million unemployed. Hiking further would mean responding with monetary policy to a price increase that monetary policy cannot reduce. Neither decision has been made, however: it will depend on September's projections and the duration of the shock.
What the markets really did
In the bond market, yields fell. The US two-year yield, the most sensitive to short-term rate expectations, closed on August 12 at 4.20% from 4.22% the day before and 4.25% on August 10; the ten-year yield at 4.68% from 4.70% and 4.72%. Immediately after the data, Reuters reported, the two-year yield dropped 4.2 basis points and the ten-year yield 3.2. The 2-10 year curve remains positive by approximately 48 basis points.
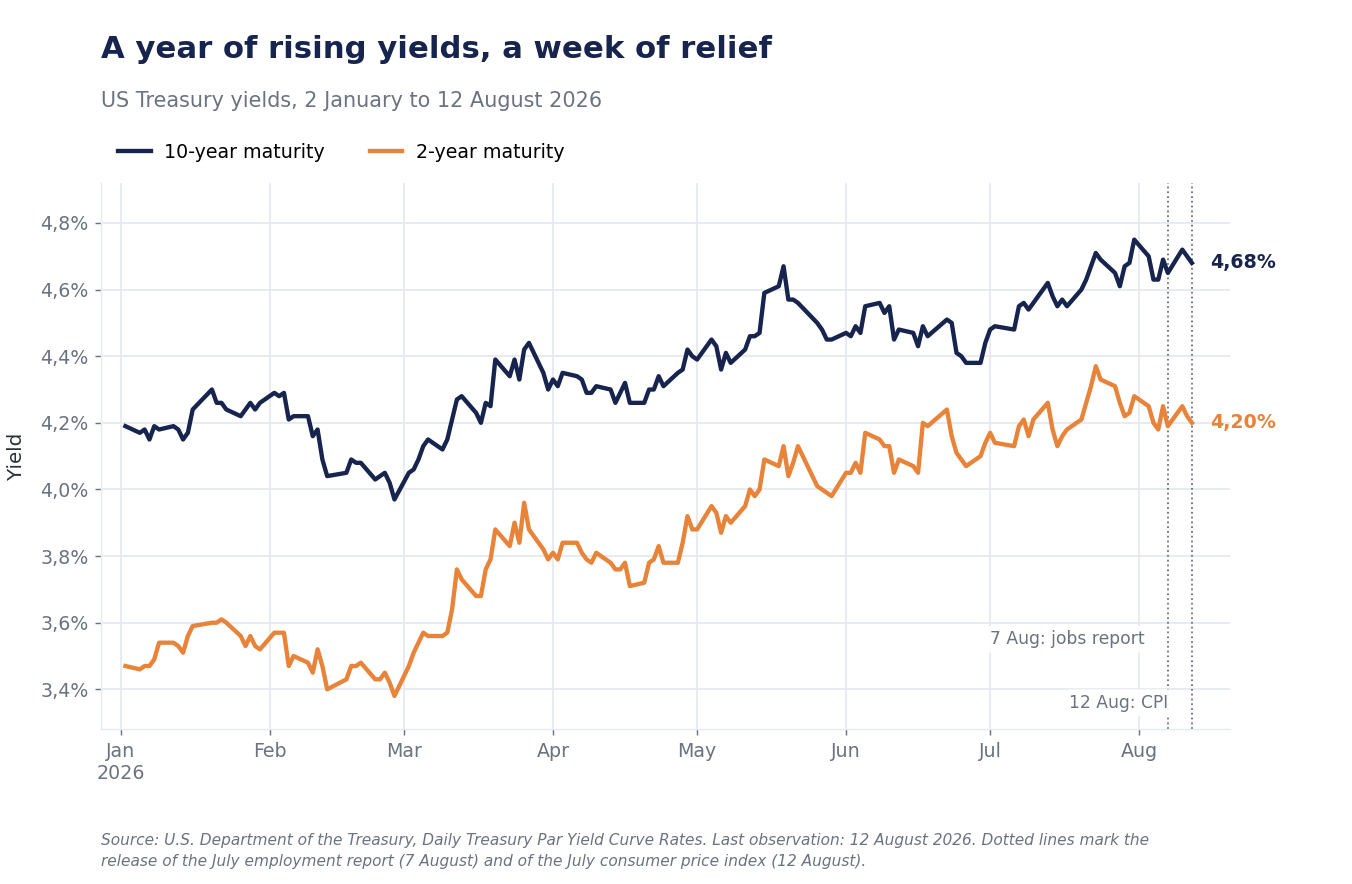
The week's movement, however, is small compared to the year's trajectory: the two-year yield was at 3.47% on January 2 and the ten-year yield at 4.19%. The market repriced rates upwards throughout 2026 and only removed a few basis points after the two August data releases; attributing the entire decline to the CPI would be incorrect, also because uncertainty over the Strait of Hormuz weighed on the same day.
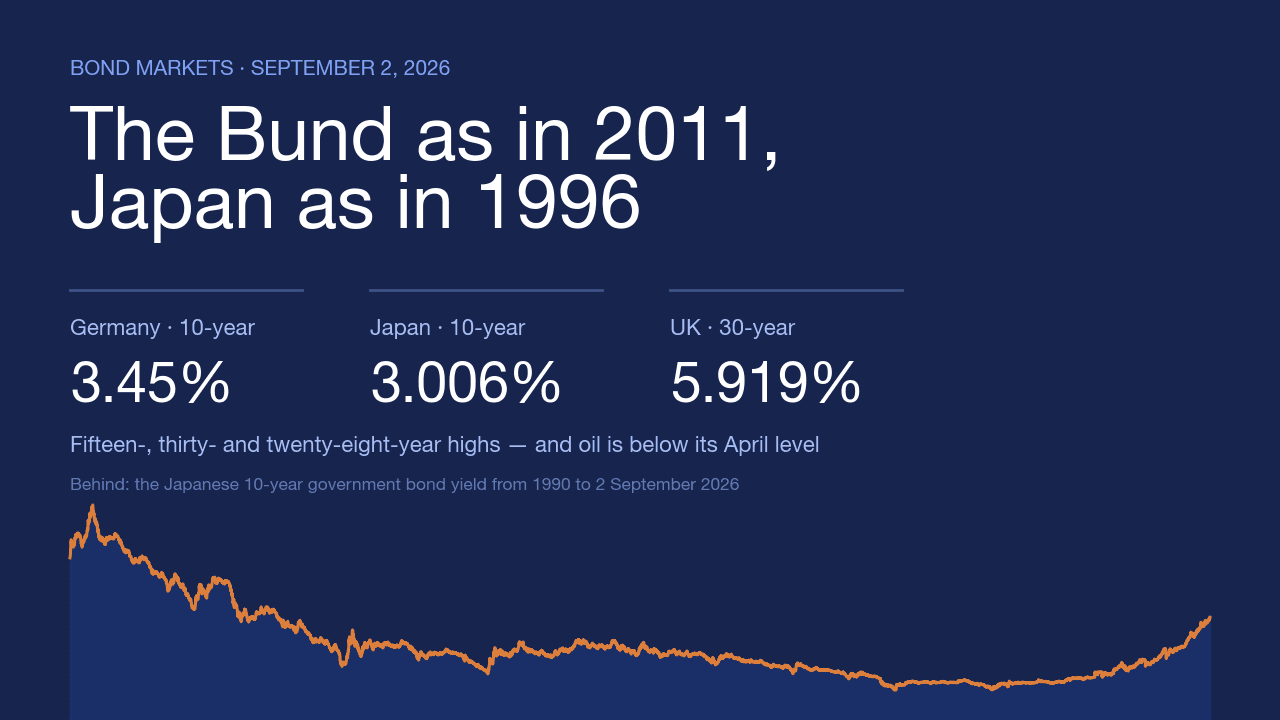
In equities, the reaction was modest and divergent across the Atlantic. Wall Street closed on August 12 with contained gains — S&P 500 +0.30%, Nasdaq +0.59%, Dow Jones +0.11% — with contributions from some tech earnings reports, while European exchanges mostly closed negative, with the FTSE Mib unchanged (-0.01%). The euro/dollar exchange rate remained stable: the ECB reference rate on August 12 was 1.1545, compared to 1.1540 on August 11. European government bonds had an uneventful day, with the ten-year BTP at 3.94%, the Bund at 3.15%, and the spread at 78 basis points from 79.
The correct interpretation is that the market had already discounted the data: a CPI perfectly in line with consensus does not shift prices. What did shift them, if anything, was the employment report on August 7.
Three scenarios, and the data that contradict them
This week's data do not identify a single path. Three scenarios can be described, with indications of what would confirm or contradict them: these are scenarios, not forecasts.
Base scenario. The energy shock remains a relative price phenomenon: overall inflation stays above 3% in the United States and between 2.5% and 3% in the euro area until year-end, then retreats as the comparison with the hot months of 2026 becomes favorable, and the two central banks remain on hold. This would be confirmed by stable core inflation, further slowing wages, and Brent not consistently exceeding one hundred dollars; it would be contradicted by core PCE above 3.5% or an acceleration in American wages.
Inflationary scenario. The Strait of Hormuz remains difficult to navigate, the barrel stabilizes above one hundred dollars, and the shock enters services prices and contractual renewals. This is the concern of the three FOMC dissenters and what Lagarde warned against when speaking of second-round effects. This would be confirmed by accelerating services on both sides, rising medium-term inflation expectations, and more generous European contractual renewals; it would be contradicted by a credible agreement on transit in the Strait.
Slowdown scenario. The American labor market continues to deteriorate, consumption follows with a few months' delay, and Europe, already stagnant, slips into stagnation behind German industry. The debate would shift from hiking to cutting within a few months. This would be confirmed by two more negative employment reports, a sharp increase in unemployment claims from current levels (199 thousand in the week ending August 1, still low), and contracting retail sales; it would be contradicted by sustained American consumption, which grew by 3.2% annualized in the second quarter.
Dates to mark
The calendar is packed. On Thursday, August 13, US producer prices for July are released, the first hint of how much of the shock is moving up the chain, and on Friday, August 14, US retail sales. On August 19, Eurostat publishes the complete harmonized data for the euro area with country details; on August 25, Destatis publishes the components of German GDP; on August 26, the BEA publishes the July PCE deflator — the number the Fed truly watches. On September 1, Istat releases the preliminary estimate of Italian August prices, which will fully incorporate the crude oil price increase from the first decade of the month. Then the two decisions: ECB on September 10, FOMC on September 15 and 16, both with updated projections.
The most important variable, however, is not statistical: it is the negotiation on the Strait of Hormuz. As long as it remains open, every projection on inflation and interest rates is conditional on an oil price that has already moved between 62 and 138 dollars this year. This is the lesson from July's data: not three economies with different problems, but three economies absorbing the same problem with different labor markets and price structures — and central banks that can only manage the second-round effects of that problem.
Sources
US consumer price index for July 2026 from the Bureau of Labor Statistics (release of August 12, 2026); detailed series downloaded from the public API of the same BLS and from the FRED database of the Federal Reserve Bank of St. Louis (CPIAUCSL, CPILFESL, CUUR0000SA0E, CUUR0000SACL1E, CUUR0000SASLE, CUUR0000SAF1, CUUR0000SAH1). Employment report for July 2026 and revisions for May and June from the BLS (August 7, 2026), covered by CNBC, NBC News, and Yahoo Finance. Gross domestic product for the second quarter of 2026 and PCE deflator from the Bureau of Economic Analysis (advance estimate of July 30, 2026; series GDPC1, PCEPILFE, PCEPI). German consumer prices for July 2026 from Destatis press release PE26_283_611 of August 12, 2026; Q2 GDP from Destatis PE26_269_811 of July 30, 2026; industrial production, orders, and foreign trade for June from Destatis press releases PE26_279_421, PE26_276_421, and PE26_278_51 (August 2026). German labor market from Bundesagentur für Arbeit press release no. 30 of July 31, 2026. Definitive Italian consumer prices for July 2026, Q2 GDP, employed and unemployed for June, industrial production, retail sales, confidence, and contractual wages from Istat press releases of July 29, 30, and 31 and August 4, 7, and 12, 2026. Euro area inflation and GDP from Eurostat flash estimates 2-31072026-AP and 2-30072026-AP. Monetary policy decisions and projections from ECB press release of June 11, 2026, from monetary policy statement of July 23, 2026, and from Federal Open Market Committee press release of July 29, 2026. Brent price from U.S. Energy Information Administration (Europe Brent Spot Price FOB). US Treasury yields from Daily Treasury Par Yield Curve Rates of the Department of the Treasury. Euro/dollar exchange rate from ECB reference rate of August 12, 2026. BTP and Bund yields, spread, and European stock market closings of August 12, 2026 from Il Sole 24 Ore; Wall Street closings of August 12, 2026 from Yahoo Finance. Implied probabilities on Fed rates from CME FedWatch tool as reported by CNBC and from federal funds futures cited by Reuters: the two readings diverge and are both reported. Coverage of the Strait of Hormuz negotiation from CNBC and Al Jazeera (June-August 2026). The conversions of US GDP from an annualized basis to a quarter-over-quarter basis, year-over-year rates calculated on indices, and average Brent prices are elaborations by the editorial staff based on the official series cited.
This article is for informational purposes only and does not constitute financial advice, investment research, a public solicitation of savings, or a personalized recommendation to buy or sell. The assessments expressed are editorial opinions based on public data as of the publication date and may change without notice. The value of investments can decrease as well as increase, and past performance is not indicative of future results. Before making any investment decision, it is advisable to consult a qualified financial advisor and evaluate the consistency of the operation with one's objectives, time horizon, and risk tolerance.