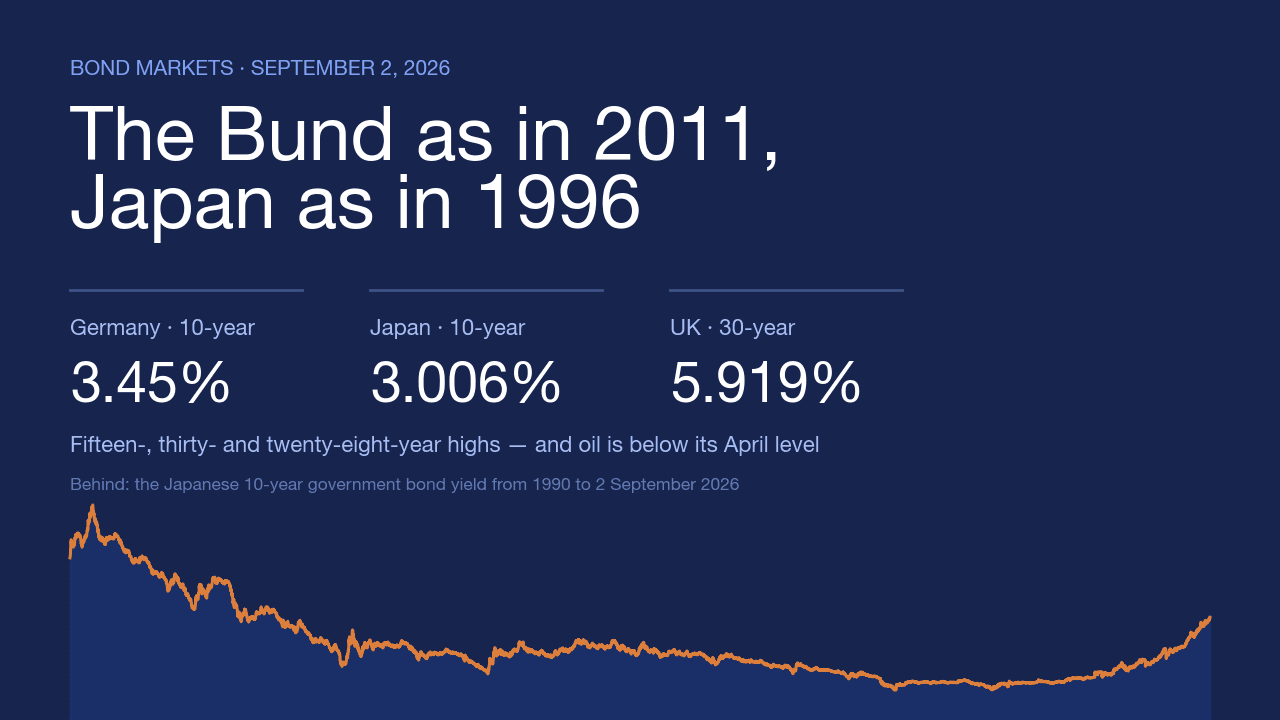


On Wednesday, September 2, 2026, the ten-year Bund yield hit a fifteen-year high and the Japanese ten-year bond closed at 3.006%, above 3% for the first time since 1996. On Thursday, markets caught their breath, but it's not over.
The movement is global and has a clear immediate cause: renewed attacks between the United States and Iran around the Strait of Hormuz have pushed oil back above 95 dollars and reignited expected inflation. However, it also has a second, less visible but more important cause: in the same month of September, the European Central Bank, the Federal Reserve, and the Bank of Japan are all meeting, and for the first time in years, the market sees them moving in the same direction — upwards. It is this second cause that explains why yields are at levels that the barrel alone would not justify.
What happened, market by market
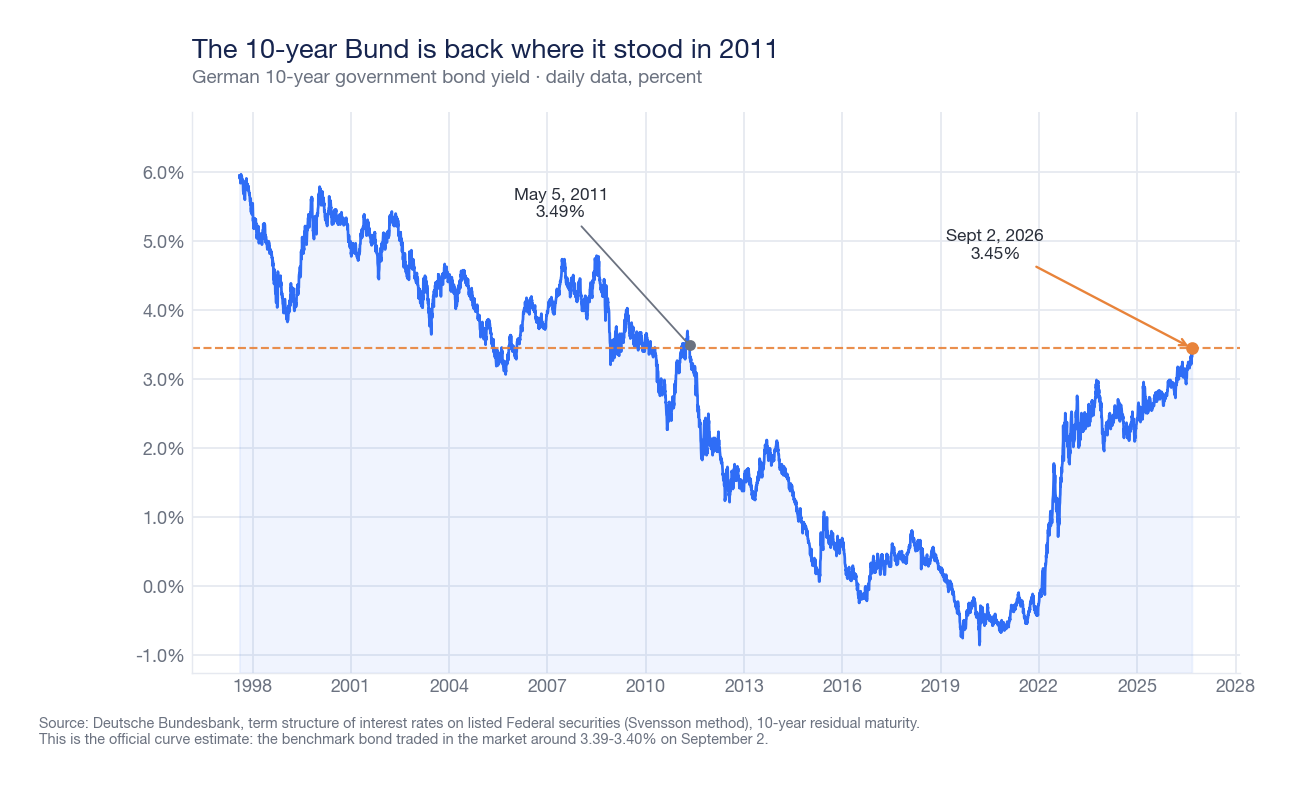
In Germany, the ten-year bond yield touched 3.3951% on Wednesday, its highest value in fifteen years, according to market data reported by Trading Economics; on Tuesday, it had already risen to 3.38%, the highest since April 2011. The official Bundesbank series — the maturity structure of rates on listed federal securities, which estimates the curve and not individual securities — marks 3.45% on September 2: the last time that series was at or above that level was on May 5, 2011, when it was 3.49%.
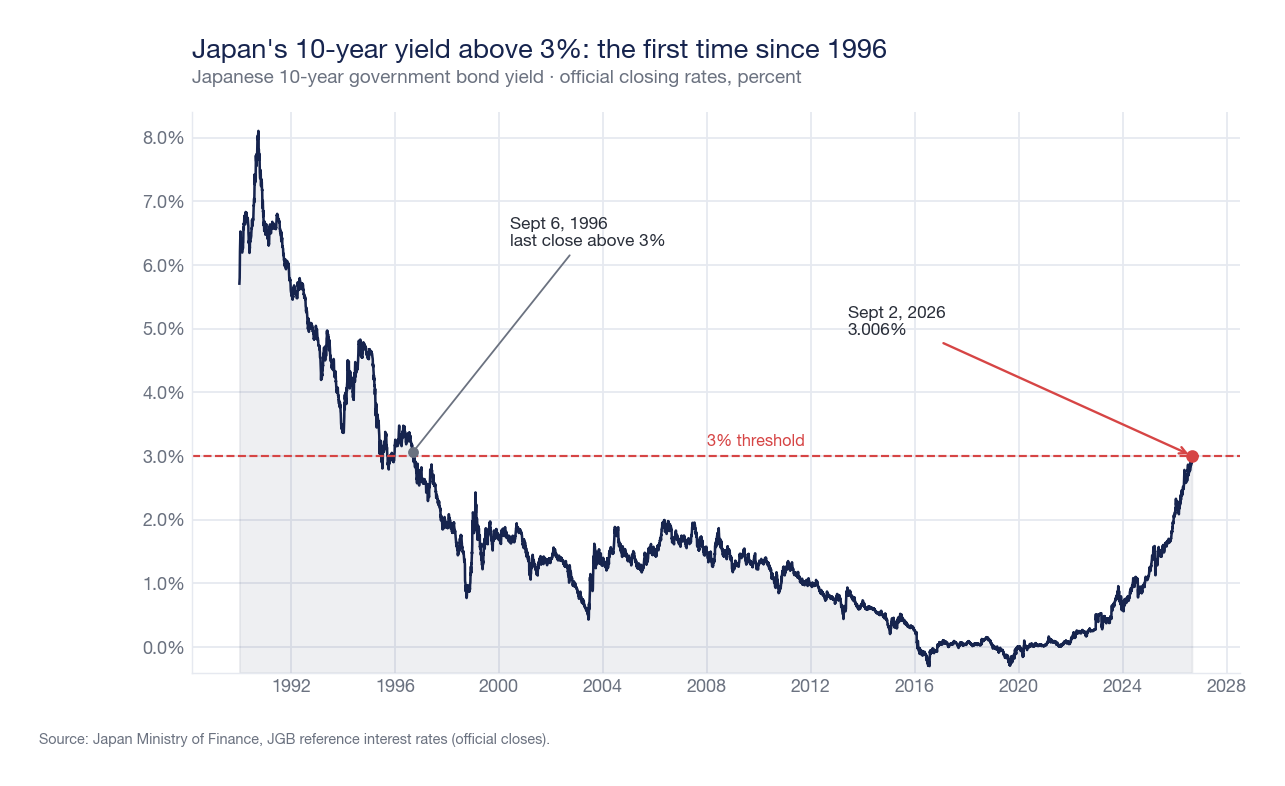
In Japan, the jump is even sharper. The ten-year yield closed on September 2 at 3.006% according to Ministry of Finance benchmark rates: the last close above 3% dates back to September 6, 1996, four days less than thirty years ago. On the rest of the curve, the twenty-year yield is at 3.864%, the thirty-year at 4.122%, the forty-year at 4.134%.
In the United States, the ten-year Treasury closed on September 1 and 2 at 4.79%, according to the official U.S. Treasury curve — the highest level since January 2025 — with the thirty-year at 5.27% and the two-year at 4.39%. In the United Kingdom, the thirty-year gilt touched 5.919% during trading, the highest since 1998, while traders priced in almost two Bank of England rate hikes by year-end.
In the eurozone, the picture is homogeneous with a single anomaly. The French ten-year OAT exceeded 4.21%, the highest since November 2008. At Wednesday's opening, the OAT yielded 4.24% against the Italian BTP's 4.22%: the French spread over the Bund, 87 basis points, was wider than the Italian one, 85. At the same time, the Spanish Bono was trading at 3.83% with a 46-point spread, the Dutch at 3.43%, its highest since May 2011.
On Thursday, the race stopped, and it's clear why
On September 3, the movement reversed. The market was moved by a single sentence: on Wednesday, when asked how long the attacks against Iran would last, U.S. President Donald Trump replied, "I don't think too long." Crude oil retreated — Brent futures at 94.88 dollars, down 0.8%, and WTI futures at 90.35 dollars, down 0.7%, in Thursday's Asian trading, according to the French agency AFP — and with it, yields.
In Italy, the ten-year BTP fell to 4.20% and the spread with the Bund to 83 basis points, with the German bond at 3.37%. In Asia, the Nikkei closed at 64,214.48 points, down 0.2%, after the previous day's slump: on Wednesday, the index had lost 1,889.70 points, 2.9%, closing at 64,325.64, with sales concentrated in semiconductors, technology, and exporters.
A truce, not a turning point. None of the factors that have driven yields in the last two months disappeared overnight: the conflict is open, European inflation has risen again, the three central banks are meeting in the next two weeks, and governments need to place more bonds than before.
Oil is the second wave, and not the highest
Here lies the data that changes the interpretation of everything else. Brent was trading at 96.02 dollars per barrel on September 1, according to the U.S. Energy Information Administration's daily series. This is 40.1% more than the summer low of 68.53 dollars on July 2: twenty-seven and a half dollars recovered in exactly two months. But it is also 42.19 dollars below the 2026 high of 138.21 dollars on April 7.
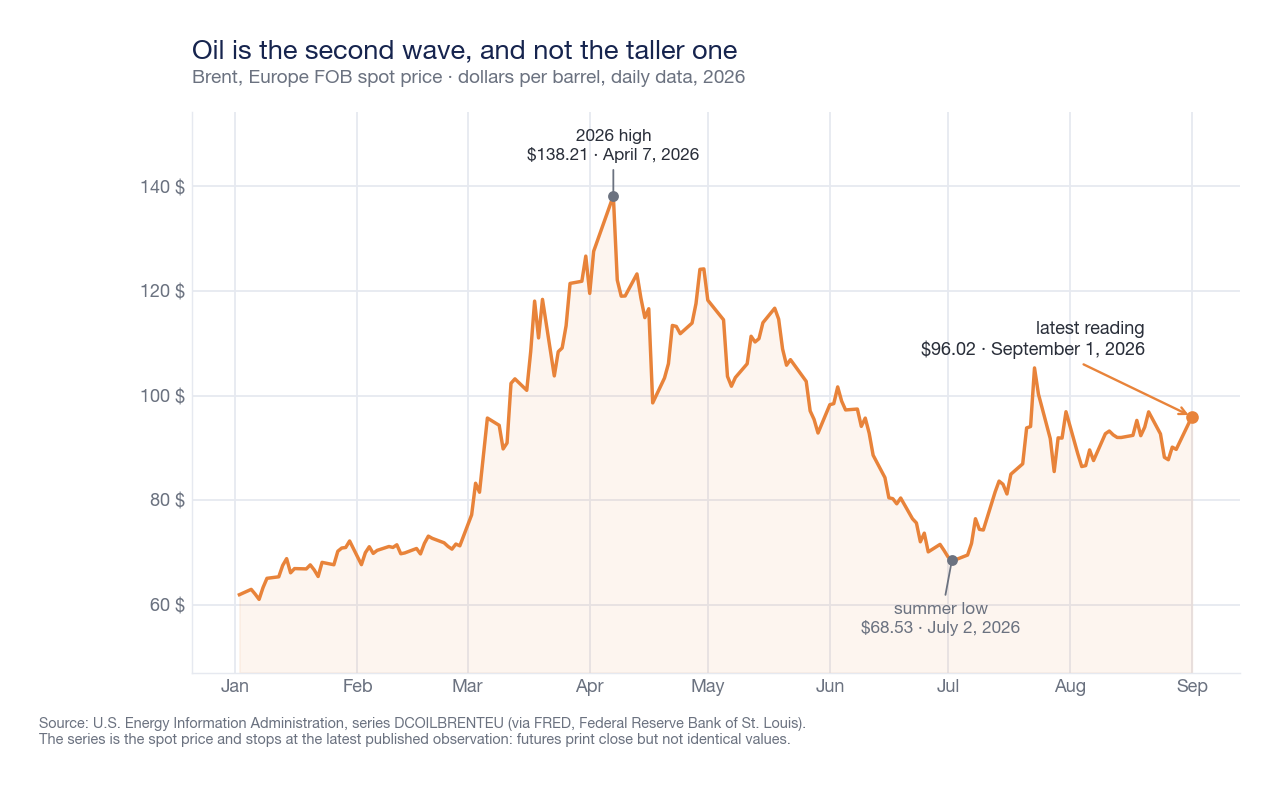
The comparison matters because in April, with the barrel at 138 dollars, the ten-year Bund was not at fifteen-year highs and the Japanese ten-year bond had not yet touched 3%. Today, oil is much lower than then, and yields are much higher. This means that the bond market is not pricing the level of energy prices: it is pricing its persistence, i.e., the idea that such a shock is no longer an isolated episode, and the fact that this time it comes while governments have to issue much more debt. The mechanism by which crude oil prices affect interest rates was explained in Oil and dollar: why two prices move the entire market.
The inflation scaring markets is almost entirely energy
The flash estimate released by Eurostat on September 1 shows eurozone inflation at 3.3% in August, up from 2.9% in July. The impetus comes almost entirely from one item: energy rose from a 10.3% year-on-year increase to a 14.3% increase. In the same month, services decreased from 3.3% to 3.0%, food, alcohol, and tobacco remained at 1.2%, and non-energy industrial goods rose from 0.9% to 1.2%.
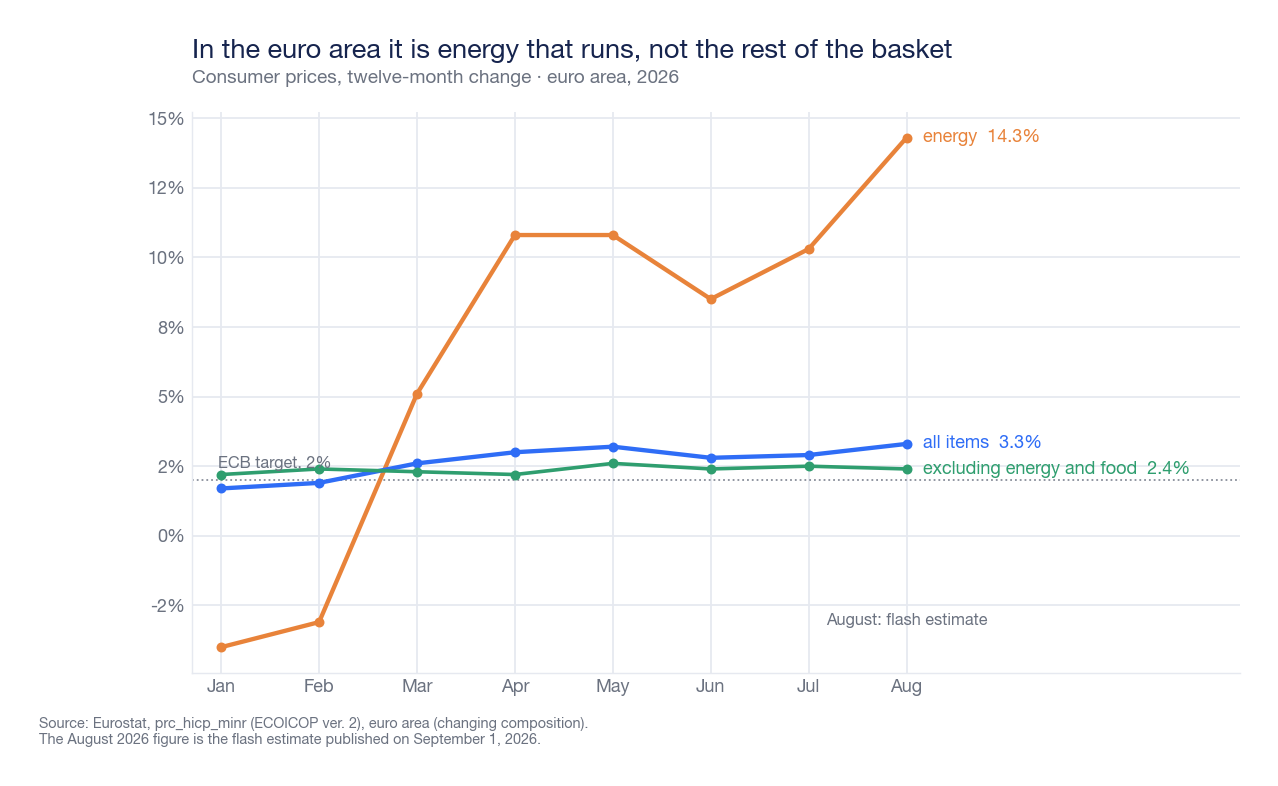
Summing the components that central banks look at to understand if inflation is becoming entrenched — the index excluding energy and food — we get 2.4% in August: the same order of magnitude as 2.2% in January and 2.6% in May. In eight months, that measure moved within a band of four-tenths of a point, while energy went from minus 4.0% to plus 14.3%. What distinguishes this type of price increase from generalized inflation, and why the difference changes the monetary policy response, is the subject of the guide Inflation: what it is, how it is measured, and why it erodes your savings.
In the United States, the picture is less reassuring. The Personal Consumption Expenditures (PCE) price index, the Federal Reserve's preferred measure, showed a 3.7% increase over twelve months in July and 3.3% excluding energy and food, according to Federal Reserve Bank of St. Louis series. Over the six months from January to July, annualized, the headline index runs at 4.1%: this is the figure the Fed chair brought to the Jackson Hole stage.
Three central banks moving in the same month
This is the real engine of the movement, and the calendar makes it unusually concentrated.
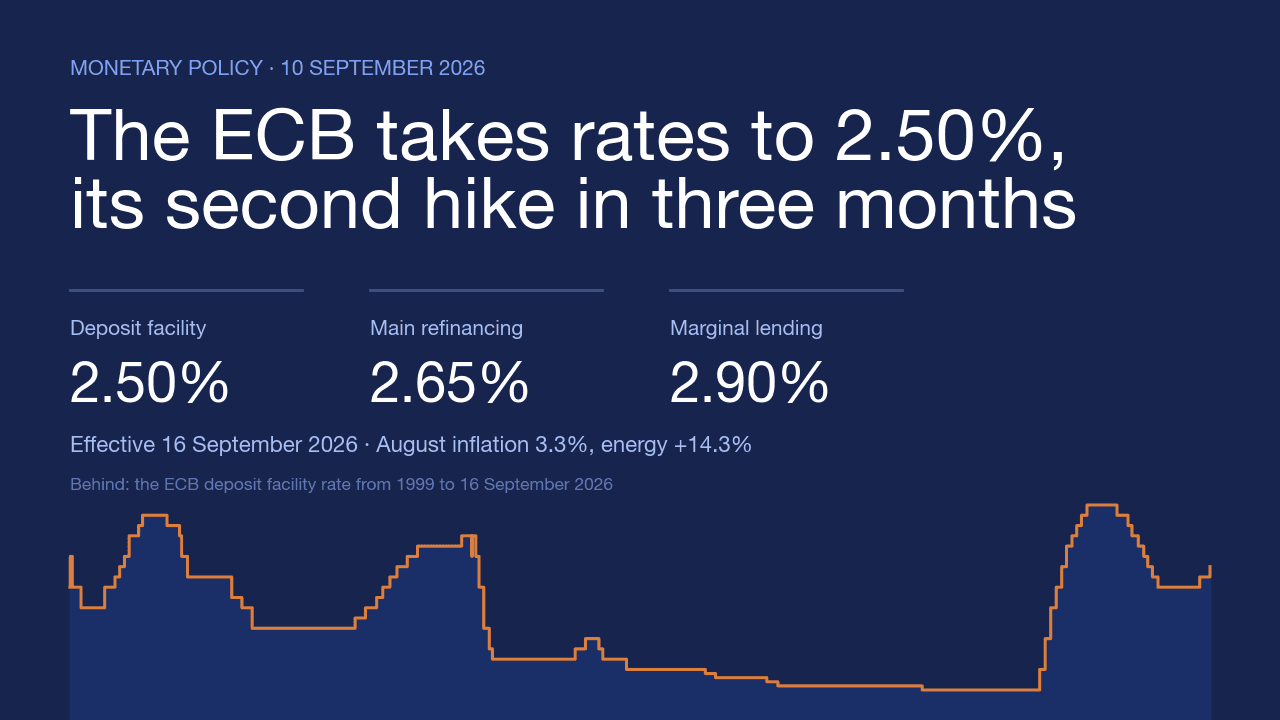
The European Central Bank has already turned: on June 11, 2026, it raised the three official rates by 25 basis points — the first hike in almost three years — bringing the deposit facility rate to 2.25%, the main refinancing operations rate to 2.40%, and the marginal lending facility rate to 2.65%, effective June 17. On July 23, it paused to gauge the effect of the war on prices, and Christine Lagarde left the door open for September. The September 10 meeting is one that brings with it the Eurosystem's macroeconomic projections: not just a decision, but a new inflation path.
The Federal Reserve arrives at its September 15 and 16 meeting — also with projections — having been on hold for nine months in the 3.50-3.75% range, set on December 11, 2025, at the end of a cutting cycle. On August 28, in Jackson Hole, Chair Kevin Warsh said that underlying price trends had not "significantly improved." The probabilities implied in rate futures, as measured by the CME FedWatch tool, shifted from a range of between 35% and 57% the previous week to over 66% for a quarter-point hike by September 1. This would be the first increase since July 27, 2023: more than three years. How to interpret a Fed decision and why the market anticipates it is explained in ECB and Fed: how central banks work and why they move everything.
The Bank of Japan meets on September 17 and 18 with its benchmark rate at 1%, after the late July pause during which a board member had already proposed raising it to 1.25%. On September 2, Governor Kazuo Ueda said that monetary policy would have to take greater account of upside risks to prices: the market read this as a precursor to a move. This is why the entire Japanese curve shifted together, and not just at longer maturities.
In the United States, the short end is rising, not the long end
The way the American curve has moved in 2026 indicates which of the two causes weighs more. Between January 2 and September 2, the two-year yield rose by 92 basis points, the ten-year by 60, and the thirty-year by 41.
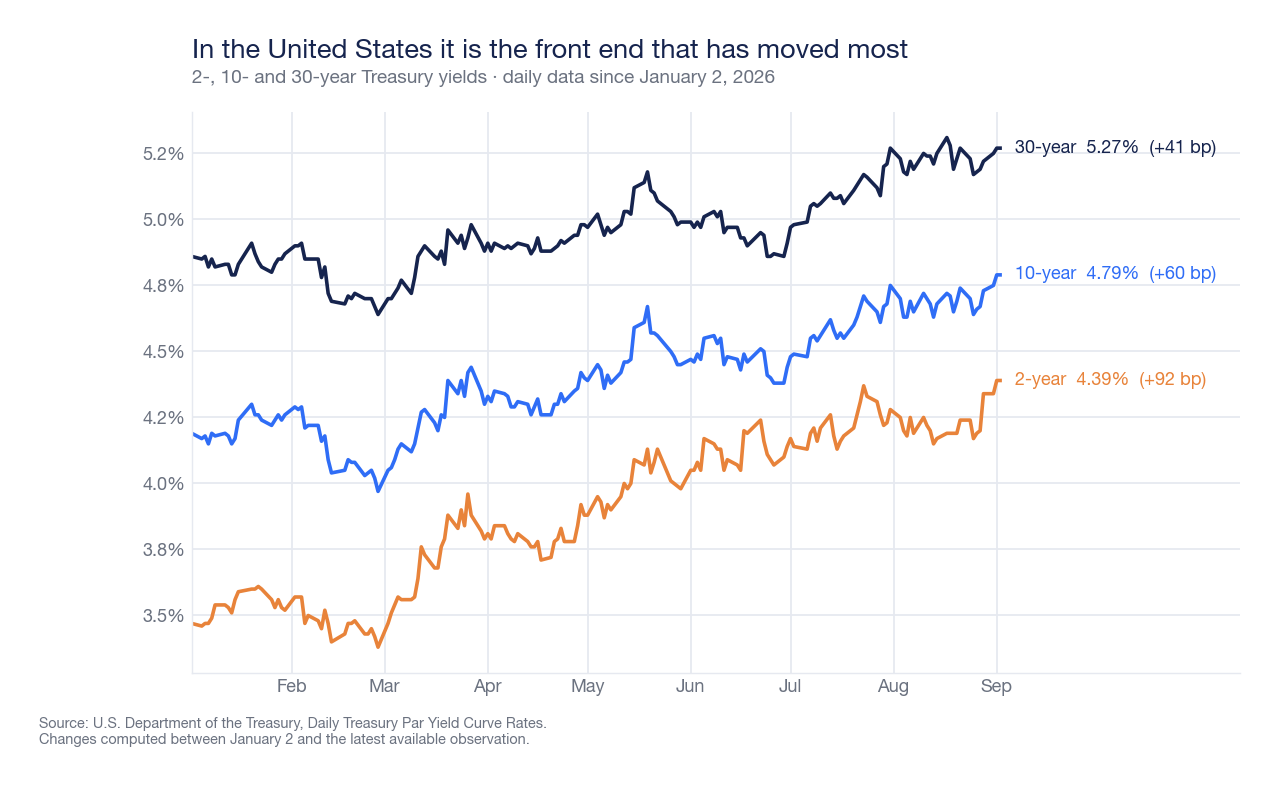
This is the exact opposite of what a market solely concerned with public finances would do: in that case, long maturities, which incorporate the risk of having to absorb emissions for decades, would give way. Here, however, it is the short end — the most sensitive to what the central bank will do in the coming months — that has run up the most. The distance between two and thirty years has narrowed from 139 to 88 basis points since the beginning of the year.
Which does not mean that the supply problem does not exist. On August 19, the U.S. Treasury at least doubled the maximum size of its bond buyback operations, from 2 to "at least" 4 billion dollars, concentrating them on maturities between ten and thirty years. The thirty-year bond fell by 9 basis points, to 5.196%, and within two sessions returned above 5.27%: the announcement bought a day, not a trend. The context of that debt — 40,000 billion dollars surpassed in August — is the subject of U.S. debt breaks through 40,000 billion.
The debt nobody wants to buy at the old price anymore
Where supply really weighs is elsewhere. The Japanese budget for fiscal year 2026 was constructed assuming a long-term rate of 3% to calculate interest expenses: exceeding that means that every yen of refinanced debt costs more than the government had budgeted. For fiscal year 2027, the working assumption has already risen to 3.8%. And the executive led by Sanae Takaichi plans an expansionary maneuver between spending and tax cuts, meaning more bonds to place.
In France, the problem is one of accounts: 118.4% debt to gross domestic product and a deficit of 5.2% projected for this year. This is why, for much of the summer, Paris paid more for its debt than Rome — a circumstance that would have been unthinkable until a few years ago. In the United Kingdom, rising long-term yields narrow Chancellor Rachel Reeves' room for maneuver ahead of the November budget.
Italy, in this context, is more of a spectator than a protagonist. The spread with the Bund remains between 83 and 85 basis points, far from past crises: the BTP yield rises because everyone's yields are rising, not because the market is questioning Italy again. How to interpret that number — and what truly distinguishes it from a generalized increase in rates — is in BTP-Bund spread: what it is, why it matters, and how to read it. The test comes soon: the Italian Treasury's calendar foresees auctions from September 9 to 26 across multiple maturities.
What changes for those with a mortgage or a business
Transmission to the real economy has already begun, but it is slower than newspaper headlines suggest. According to Banca d'Italia, in June 2026 the overall effective annual rate on new home purchase mortgages was 3.95%, practically unchanged from 3.96% in May: the ECB's June 11 hike had not yet filtered into contracts. The twelve-month Euribor, the benchmark for variable-rate mortgages, rose from an average of 2.245% in January to 2.809% in June; the three-month rate reached 2.397%.
For a typical mortgage of 126,000 euros over twenty-five years, the 25 basis points in June are worth about sixteen euros per month, from just under 590 to about 606 euros per installment. This is not a dramatic figure taken alone: it becomes so if the increases become two or three, and if in the meantime energy consumes another part of the same income.
For businesses, the cost is higher. Also in June, rates on new loans to non-financial corporations were 3.56%, with peaks of 4.28% for loans under one million euros — precisely the segment where small and medium-sized enterprises borrow. Loans to households, meanwhile, grew by 2.7% year-on-year: credit demand has not collapsed, but its price has.
And what about those who already hold the bonds in their portfolio?
It's worth recalling the mechanics, because on days like these it's often misrepresented. The price of an already issued bond and its yield move in opposite directions: if new bonds pay 4.20% and the bond I hold pays 3%, the only way someone will buy it from me is if I sell it for less than I paid. The longer the remaining maturity, the larger that discount — which is why in this movement, thirty- and forty-year bonds lost much more than two-year bonds.
This loss, however, is only realized by those who sell. Those who hold the bond to maturity collect the nominal value and all agreed coupons, regardless of how much that bond fluctuated in the meantime: the risk they run is not today's price, but the fact that the promised coupons are worth less in real terms if inflation remains above expectations. Those who still have to invest, on the other hand, buy coupon flows today that did not exist twelve months ago. These are three different positions in the face of the same movement, and there is no single answer valid for all three: it depends on time horizon and objectives, which are personal matters.
What to watch, and when
The next three weeks contain almost all the answers. From September 9 to 26, the Italian Treasury returns to the market with scheduled auctions: this is where it will be measured whether the rise in yields is a market phenomenon or a demand problem. On September 10, the ECB decides and publishes new projections: the figure to watch is not the rate, but the inflation path for 2027, i.e., how temporary Frankfurt believes the energy shock to be. On September 15 and 16, it's the Fed's turn; if it hikes, it would end a more than three-year hiatus from rate increases. On September 17 and 18, the Bank of Japan responds, with its curve already above the level on which the government built its budget.
In the background remains the only variable that no calendar contains. Despite the attacks, approximately eight million barrels of crude oil continue to transit daily through the Strait of Hormuz: it is this flow, not military communiqués, that will decide whether Brent remains around 95 dollars or returns towards April's 138. And it is oil, ultimately, that will decide how long Thursday's truce will last.
Sources
German government bond yields from the daily series of the Deutsche Bundesbank on the maturity structure of listed federal securities (Svensson method, ten-year residual life) for historical comparison, and from market data reported by Trading Economics (September 2 and 3, 2026) for intraday levels. Japanese bond rates from the Ministry of Finance of Japan's JGB benchmark rates, official closes from 1986 to September 2, 2026. US yields from the U.S. Department of the Treasury's Daily Treasury Par Yield Curve. Brent prices from the daily series "Europe Brent Spot Price FOB" of the U.S. Energy Information Administration (official file RBRTEd, cross-referenced with the same series disseminated by the Federal Reserve Bank of St. Louis with code DCOILBRENTEU): these are spot prices, not futures quotes. Futures quotes for September 3 come from the French agency AFP. Eurozone consumer price index from Eurostat's flash estimate of September 1, 2026, and from table prc_hicp_minr (ECOICOP version 2, variable composition eurozone). US Personal Consumption Expenditures price index from the PCEPI and PCEPILFE series of the Federal Reserve Bank of St. Louis. Decisions and calendar of the European Central Bank, the Federal Reserve, and the Bank of Japan from their respective official press releases and calendars; implied probabilities in rate futures from the CME Group's FedWatch tool, reported by CNBC and Forbes (August 28 - September 1, 2026). BTP, OAT, and Bonos yields, spreads, and Italian auction calendar from QuiFinanza and ANSA (September 1-3, 2026). UK gilts, US Treasury buybacks, French and Japanese public accounts, and statements by Kevin Warsh, Kazuo Ueda, and Donald Trump from Bloomberg, CNBC, Reuters, Euronews, The Japan Times, and AFP (August 19 - September 3, 2026). Nikkei 225 closes for September 2 and 3 were cross-referenced with official index values published by Nikkei Inc. Mortgage and business loan rates, Euribor, and credit growth from Banca d'Italia data for June 2026. Calculations on variations, spreads, distances from highs, and mortgage installments are editorial analyses based on the cited data.
This article is for informational purposes only and does not constitute financial advice, investment research, public solicitation for savings, or a personalized recommendation to buy or sell. The assessments expressed are opinions of the editorial staff based on public data at the date of publication and may change without notice. The value of investments may decrease as well as increase, and past returns are not indicative of future returns. Before making any investment decision, it is advisable to consult a qualified financial advisor and evaluate the consistency of the operation with one's objectives, time horizon, and risk tolerance.