

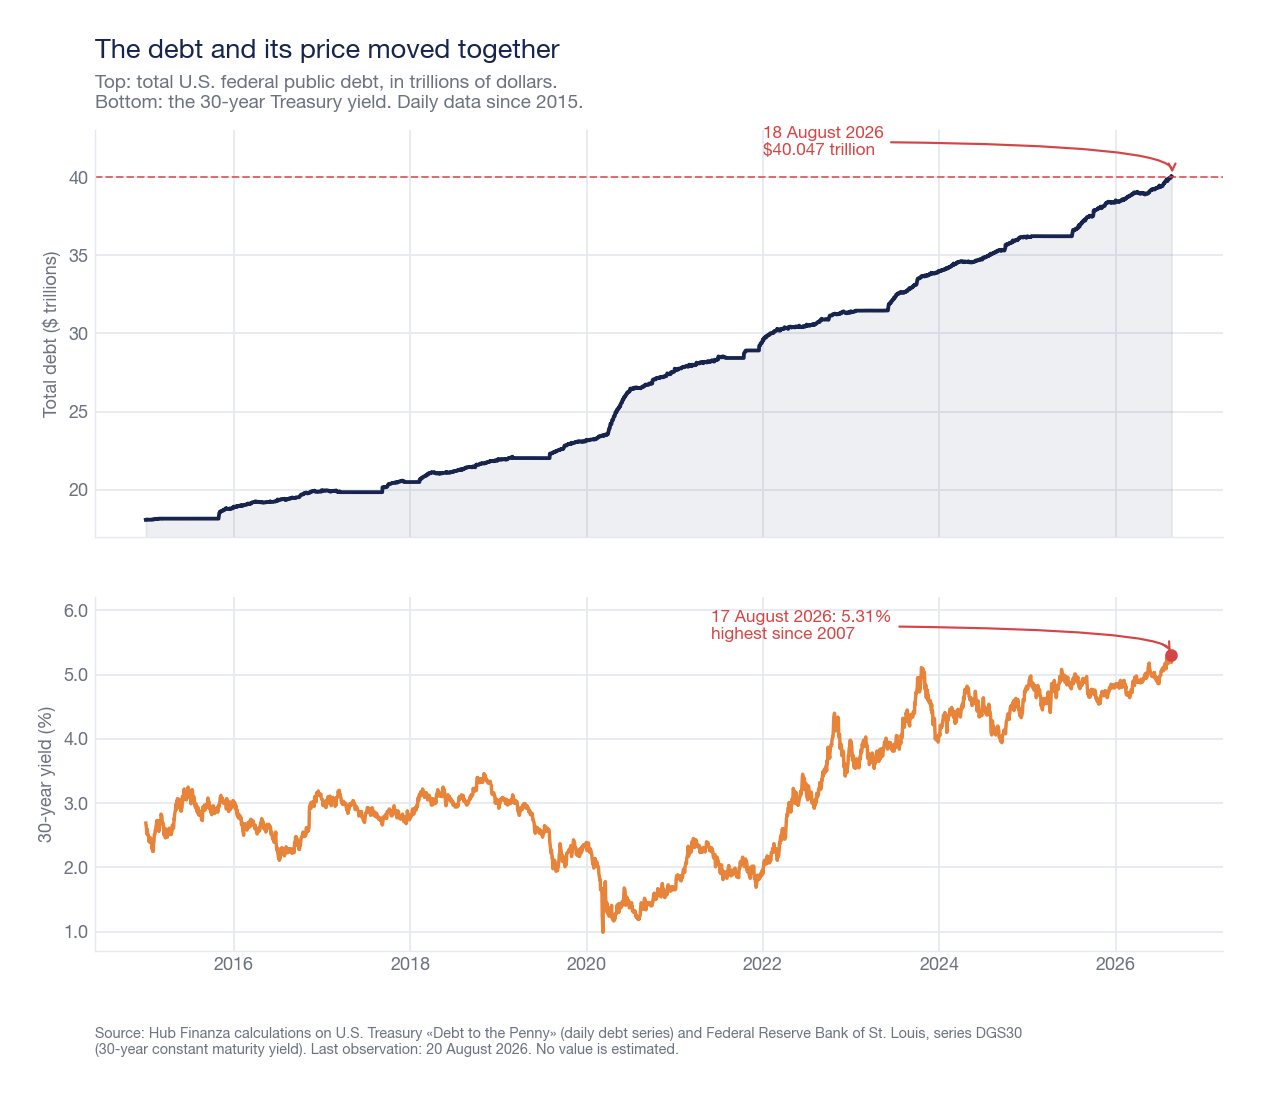
On Tuesday, August 18, 2026, the United States federal public debt exceeded $40 trillion for the first time: exactly $40.047 trillion, according to the daily «Debt to the Penny» report from the Department of the Treasury, which fell to $40.033 trillion in the August 20 report. On the same day, in the US government bond market, the 30-year yield reached 5.31% — its highest level since July 9, 2007, that is, for nineteen years.
The two news items were reported separately. They are the same event viewed from two sides: from the perspective of the issuer of the debt and from the perspective of those who decide at what price to buy it. Debt is quantity; yield is price. And the price, right now, is rising precisely on the segment used to finance that quantity: while the Federal Reserve keeps short-term rates between 3.50% and 3.75%, the market demands 5.27% from the Treasury to lend money for thirty years. This article brings the two sides together, because separated, they don't explain each other.
The 40 trillion threshold and the number markets are really watching
The round figure makes headlines, but first it needs to be put into perspective — and this is stated by the very sources that disseminated it. The Wall Street Journal, cited by ANSA on August 20, observes that the absolute number has symbolic value and is not economically significant in itself. Forty trillion is not a threshold beyond which something happens: it is a number that, in nominal dollars, was bound to arrive sooner or later.
What matters is the ratio between debt and gross domestic product, and the speed at which the former grows relative to the latter. In the first quarter of 2026, gross federal debt was 122.6% of GDP according to the Federal Reserve Bank of St. Louis series; by relating the $40.033 trillion of August 20 to the second quarter 2026 GDP ($32.475 trillion annualized, estimate by the Bureau of Economic Analysis), the figure reaches 123.3%.
Here, a misunderstanding that has been present in many recent reports needs to be corrected. The correct comparison is not with the period before World War II — in 1939, federal debt was about 44% of GDP, less than half of today's figure — but with the peak reached at the end of the conflict: about 121.7% in 1946. The United States is not approaching that level: it has just surpassed it. With a difference that weighs more than the number itself: in 1946, the peak was the legacy of a finished war, and from there the ratio decreased for thirty years; today, it arrives in peacetime, with a growing economy and without a closing event.
Speed is the second data point. Debt reached $39 trillion on March 17, 2026, and $40 trillion on August 18: one trillion in five months. In the twelve months up to August 20, the increase was $2.853 trillion. To give a measure of the pace, the previous one trillion — from $38 trillion to $39 trillion — had taken 147 days, and the one before that, from $37 trillion to $38 trillion, just 71.
A final clarification, which is necessary to understand the following sections: of the $40.033 trillion, $32.279 trillion is held by the public — i.e., by investors, banks, funds, foreign central banks — and $7.754 trillion are intragovernmental holdings, essentially what the state owes to its own pension funds. It is the first of these two numbers, not the total, that must find a buyer in the market every day. And to understand how its price is formed, one must look at bonds.
What a Treasury promises, and why its yield rises when debt concerns grow
A US government bond — a Treasury — is a loan. Whoever buys it gives the Treasury a sum today and receives in return a fixed periodic coupon and the repayment of the principal at maturity. The coupon, once the bond is issued, never changes. What changes is the price at which that bond trades on the market, and from there its yield: the effective annual gain for those who buy it today at that price and hold it until maturity.
This leads to the mechanism that explains everything else, and it is counterintuitive the first time one encounters it: price and yield move in opposite directions. If a bond pays $4 a year and costs $100, it yields 4%. If investors sell it and the price drops to $90, those $4 are worth 4.4% of what was spent: the yield rises because the price has fallen. When one reads that «Treasury yields have soared,» one is reading that someone has sold those bonds, or has only bought them demanding to pay less. This is the same mechanism that governs BTPs, and which we explained step-by-step in the guide on what the BTP-Bund spread is and how to read it.
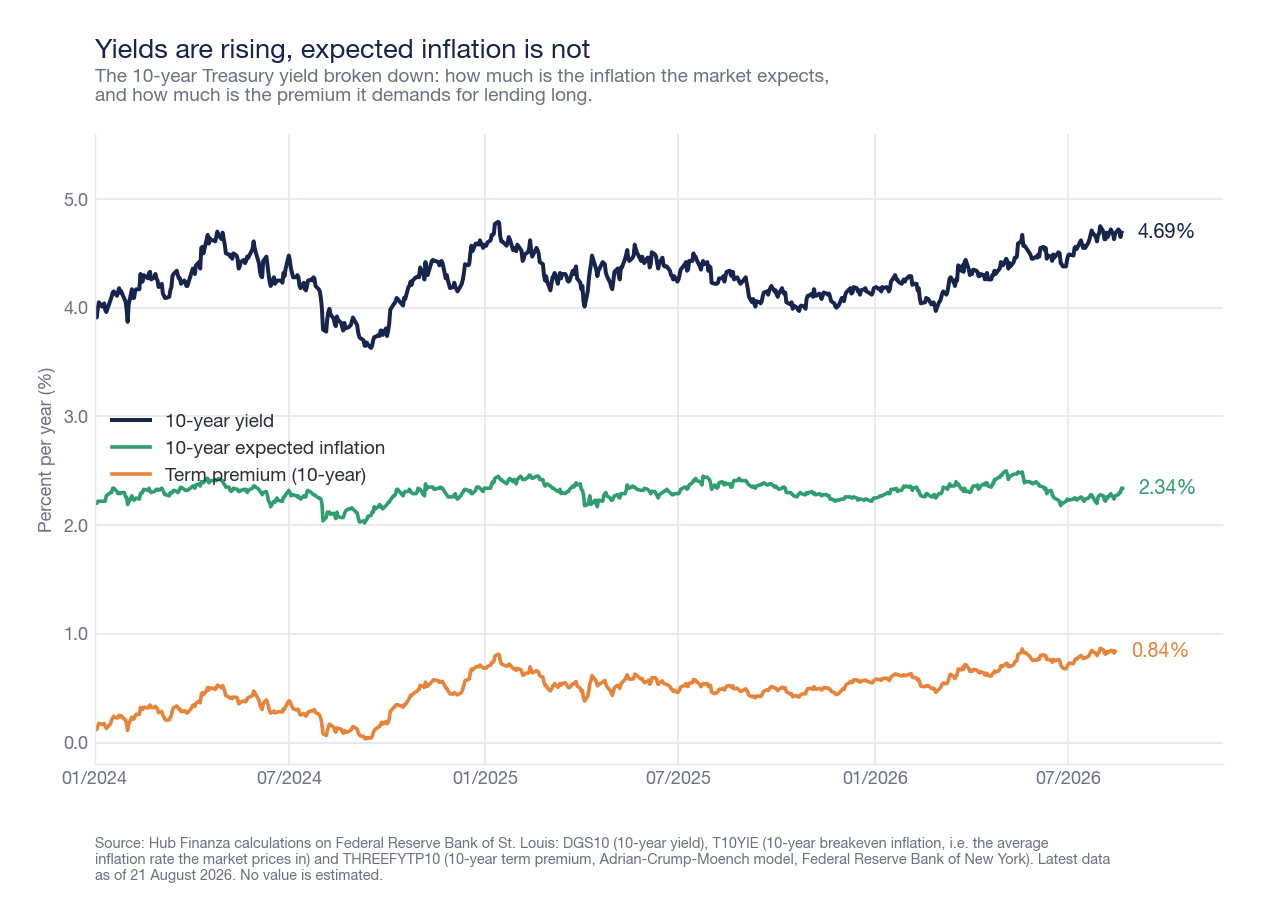
The yield that the market demands can be broken down into three parts: how much it yields to hold money safely for that duration (which depends on central bank rates, expected throughout the period), how much inflation is expected in the meantime, and a third part — the term premium — which is the extra compensation demanded for the risk of tying up money for a long time. The third part is what moves when the market's perception of the issuer's soundness changes. And it is, as we will see, what has moved.
The August 21 curve: the Fed holds the short end steady, the market raises the long end
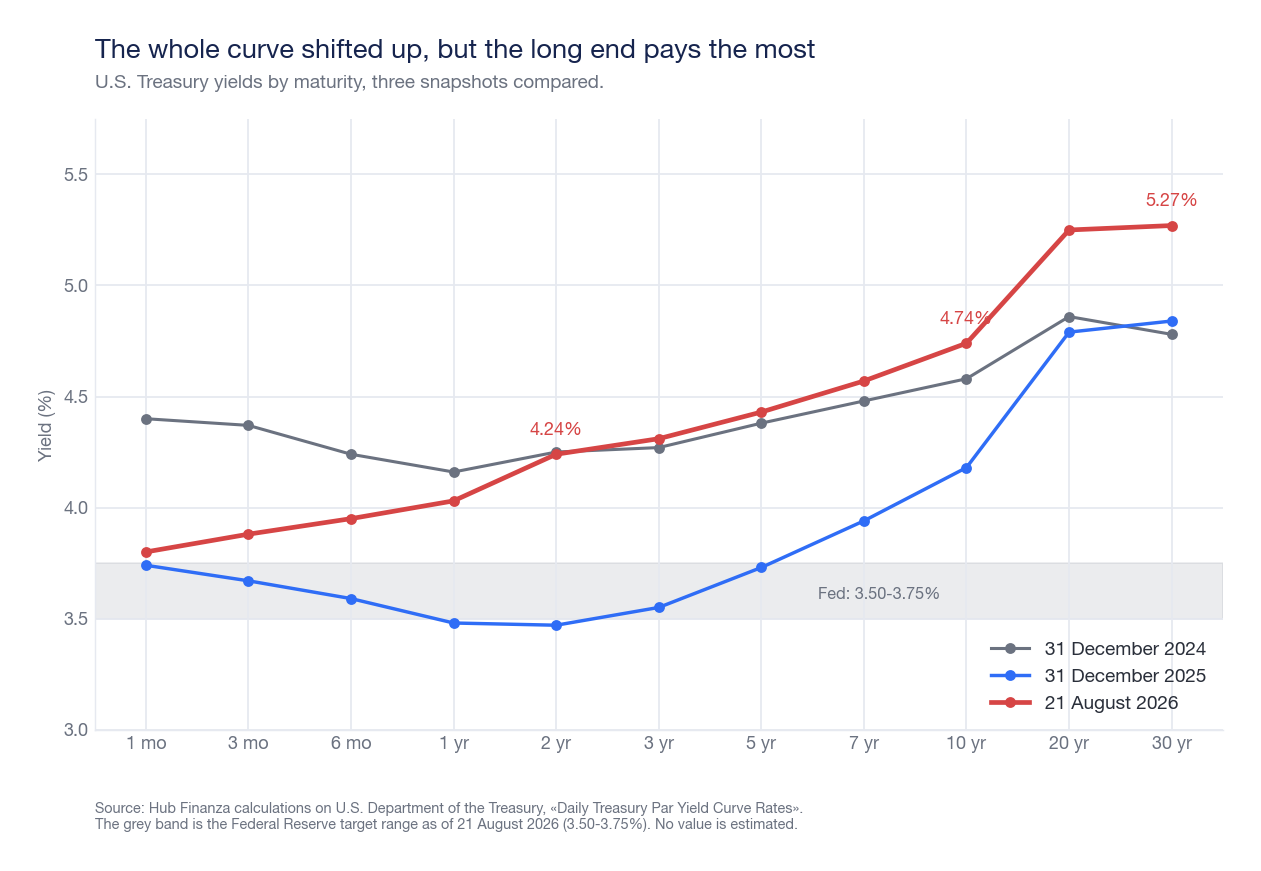
The most useful snapshot is the yield curve: the yield of government bonds ordered by maturity, from the one-month bond to the thirty-year bond. At the official Treasury report on August 21, 2026, the US curve was as follows: 3.80% at one month, 3.88% at three months, 3.95% at six months, 4.03% at one year, 4.24% at two years, 4.31% at three, 4.43% at five, 4.57% at seven, 4.74% at ten, 5.25% at twenty, and 5.27% at thirty years.
The short end is governed by the Federal Reserve, which on August 21 kept the target range for rates between 3.50% and 3.75%: bonds up to one year stay around that level, because no one lends at three months at a rate too different from where they can park liquidity at the central bank. How rate decisions are transmitted to other prices was reconstructed in our guide on monetary policy, rates, and currencies.
The long end, however, the Fed does not govern: the market does. And the market today demands 152 basis points — one and a half percentage points — more than the upper limit of official rates to lend for thirty years. The comparison with the two previous snapshots shows how this came about. At the end of 2024, the curve was almost flat: 4.25% at two years and 4.78% at thirty years. At the end of 2025, the short end had dropped to 3.47% on two years while the thirty-year remained at 4.84%: the Fed had cut rates and the long end had not followed. In 2026, everything rose — the two-year by 77 basis points, the ten-year by 56 — but only the long end reached levels not seen in nineteen years.
It is worth stating this precisely, because the phrase «yields have soared» is imprecise: in terms of variation, in 2026 the largest increase was on the two-year, and it is the consequence of expectations of Fed cuts that were progressively cancelled. The anomalous fact is not how much the long end has risen, but where it has arrived, and especially when: in days when US data was weak.
Why the long end rises: it's not expected inflation, it's the risk premium
This is where the two threads tie together, and fortunately, it is verifiable with numbers rather than opinions. If long-term yields were rising because the market fears more inflation, it would be seen in the expected inflation embedded in the prices of indexed bonds — the so-called ten-year inflation differential. This did not happen: that value was 2.25% at the end of 2025, 2.24% at the end of June 2026, and is 2.34% on August 21. In eight months, it moved by nine hundredths of a point, while the thirty-year rose by over forty.
What did move, however, is the term premium. The Federal Reserve Bank of New York's estimate for the ten-year — the Adrian-Crump-Moench model, the standard measure — rose from 0.571% at the end of 2025 to 0.84% on August 14, 2026, the highest value of the year. To give a measure of the regime change: in December 2020, the same premium was negative, at −0.48%. Investors were paying a premium just to hold long-term US government bonds; today they demand a discount to do so.
The clearest evidence is in the calendar. The rise of the thirty-year to 5.31% on August 17 came just days after unexpected US retail sales fell by 0.6% and July producer prices were flat. Weak data and no upstream inflationary pressure: in the textbook, two reasons why yields should fall. They rose. When the price of long-term money moves contrary to what economic data suggests, the variable speaking is another, and it is the quantity of paper that will need to be placed.
On the front of realized inflation, for completeness: the US consumer price index for July 2026 registered +3.36% over twelve months, with the core component at 2.47%. Inflation is above the Fed's 2% target, and this is one of the reasons cited by operators in explaining sales on the long end, but the market continues to discount a return to around 2.3% on average over the next ten years. We detailed this calculation in our analysis of July 2026 macroeconomic data.
The wall of maturities: one-third of the debt returns to the market within twelve months
Public debt is not a loan that is repaid: it is a loan that is renewed. Every bond that matures is replaced by a new bond, issued under the conditions of the day it is issued. And this is what transforms a market yield into a balance sheet item.
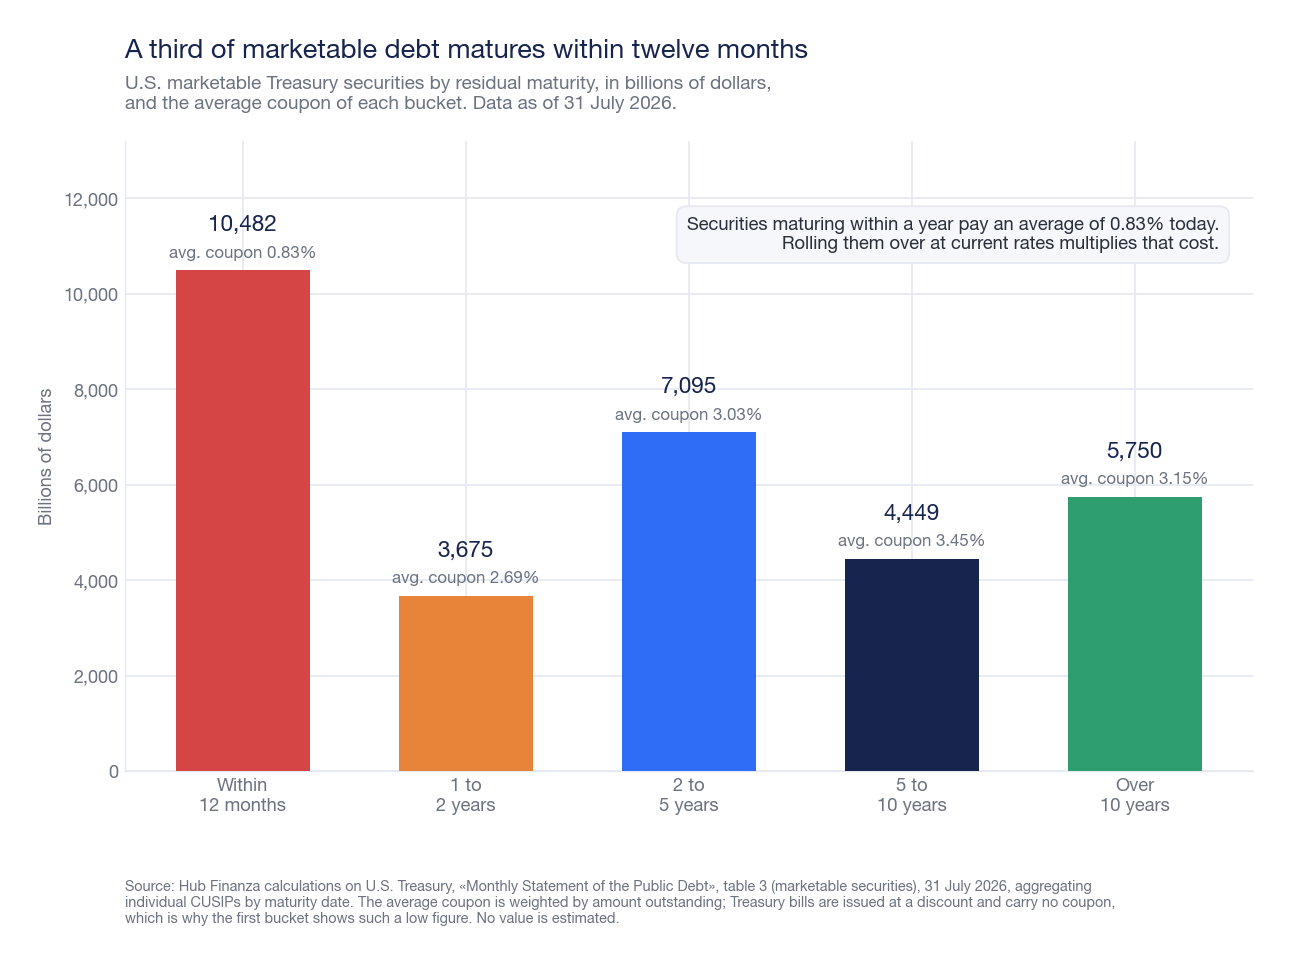
As of July 31, 2026, negotiable securities in circulation were worth $31.455 trillion: $6.989 trillion in short-term bills, $16.172 trillion in medium-term notes, $5.489 trillion in long-term bonds, $2.150 trillion in inflation-indexed securities, and $652 billion in variable-rate securities. Aggregating individual codes by maturity date, $10.482 trillion — 33.3% of the total — matures within twelve months.
One-third of US negotiable debt, in other words, must find a buyer by the summer of 2027, at the rates prevailing on that day. This is why the level of the curve is not an abstract figure: it is the price of an auction that repeats every week. On August 17, to give a concrete example, a $25 billion placement of long-term securities closed at 5.216%.
The average coupon for that maturing segment is 0.83%, a number that should be read carefully: it is so low because it includes short-term bills, which are issued below par and formally do not pay a coupon. Isolating only the coupon-bearing notes and bonds maturing within the year — $2.916 trillion — the average coupon is 2.94%. These are securities issued between 2016 and 2021, in a world of low rates. Refinancing them today on the two-year at 4.24% means a jump of 1.3 percentage points, or about $38 billion in additional annual interest on that single slice.
The gap that decides the bill: 3.447% the Treasury pays, 5.27% the market demands
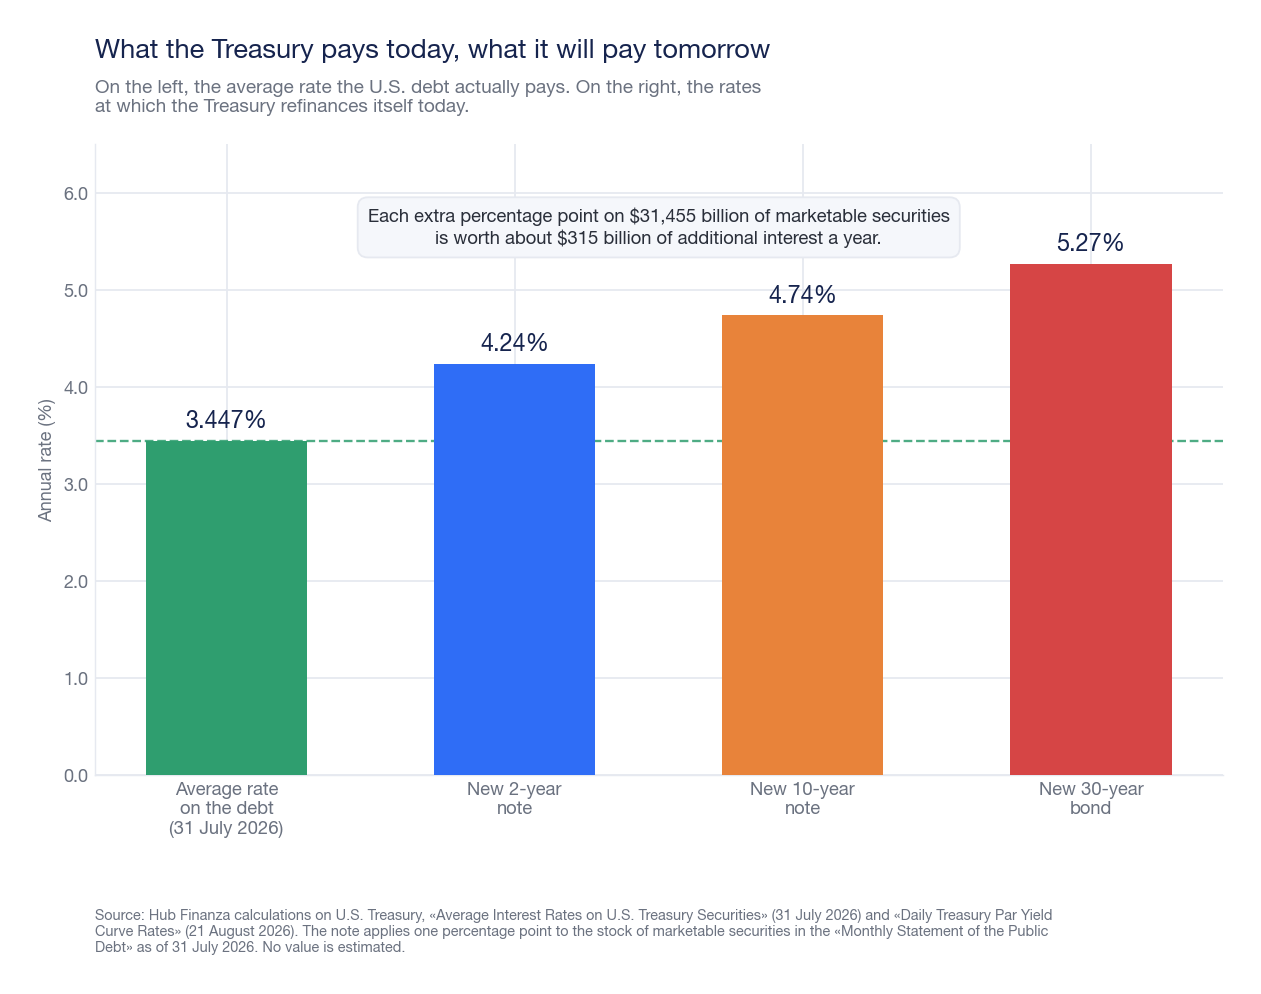
And here it is, the number that brings the two articles into one. As of July 31, 2026, the average rate actually paid by the US Treasury on all interest-bearing debt was 3.447%: 3.309% on notes, 3.442% on long-term bonds, 3.758% on short-term bills. In the market, the same Treasury today pays 4.24% for two years, 4.74% for ten years, and 5.27% for thirty years.
American debt, in other words, is still enjoying conditions negotiated in a bygone era. The average cost is lower than the marginal cost, and the difference will close on its own: yields don't need to rise further, they just need to stay where they are as old bonds mature. This is an already decided increase in spending, which will manifest in the budgets of the coming years regardless of what the Fed does on the short end.
The order of magnitude is quickly stated: one percentage point more on the average rate of the $31.455 trillion in negotiable securities is worth approximately $315 billion in additional annual interest. Even just a tenth of a point — ten cents on the curve, the kind of movement that goes unnoticed in a market day — is worth $31 billion a year.
The bill is already visible in Treasury data. Gross interest on debt was $1.133 trillion in fiscal year 2024 and $1.220 trillion in 2025; in the first ten months of fiscal year 2026, ending in July, it is already $1.170 trillion. The Congressional Budget Office estimates net interest spending for 2026 at around $1 trillion, equal to 3.3% of GDP and about 14% of total federal spending, and projects it to reach $2.1 trillion — 4.6% of GDP — by 2036, expecting it to surpass Medicare spending by 2028 and defense spending by 2038.
Who is buying: supply grows as foreign demand withdraws
A price is formed by two hands, and so far we have only looked at the selling hand. The other is retreating. According to Treasury International Capital data for June 2026, published on August 17, foreign holdings of US government bonds fell to $9.299 trillion, $72.1 billion less than the $9.371 trillion in May: the third decline in four months since they hit a record in February.
The two main foreign holders eased their positions together. Japan fell to $1.116 trillion from $1.143 trillion in May (−2.3%), remaining the largest foreign creditor but well below the peak of $1.325 trillion in November 2021. China reduced its holdings by 4% in a single month, from $659.3 billion to $633.4 billion: the lowest level since September 2008. Net flows into Treasury purchases plummeted from $56.6 billion in May to $6.8 billion in June.
Added to this is new competition on the demand side: according to Bloomberg, the wave of bond issues by companies engaged in artificial intelligence investments is absorbing some of the money seeking long-dated securities. Anshul Pradhan, head of US rates strategy at Barclays, summarized the operators' position by saying that he continues to advise against betting against the weakness of the long end: for it to reverse, positive surprises on public finances, fewer AI-related issues, or weaker economic data would be needed.
More supply and less demand: the term premium mentioned above is not a statistical abstraction; it is what happens when these two curves move in the same wrong direction.
What changes for mortgages, BTPs, and bond funds
The yield on the US ten-year bond is the benchmark on which a huge portion of global credit is priced, and the consequences arrive long before any dramatic debt scenario.
In the United States, the transmission is immediate and affects households: the average rate for a 30-year fixed-rate mortgage was 6.65% on August 20, 2026, compared to 6.15% at the end of 2025. On a $400,000 mortgage, half a point more means about $131 more per month, $1,571 per year, little more than $47,000 over the entire loan duration. This is the same mechanism we followed in the article on US mortgage rates at year highs.
In Europe, the channel is indirect but visible. The Italian ten-year yield rose to 3.881% on average in July 2026 from 3.734% in June, and the German one to 3.070% from 2.964%: the differential between the two remains around 81 basis points, but the starting level has risen for both. For those holding BTPs in their portfolio, the effect is twofold: already held bonds lose market value when yields rise, while new issues offer more generous coupons. Those who hold the bond until maturity collect what was agreed upon; those with a bond fund or ETF, however, see the price updated daily, which is why such a fund can show losses at a time when «rates are high».
Finally, regarding the exchange rate, a widespread expectation needs to be corrected. The surpassing of $40 trillion did not overwhelm the dollar: the euro/dollar exchange rate was 1.1699 on August 21, 2026, compared to 1.1750 on December 31, 2025, and the broad dollar index calculated by the Federal Reserve was 118.90 on August 14 compared to 119.75 at the end of 2025. In 2026, the dollar is substantially stable; the real decline was in 2025, when the same index started from 129.28. The currency dynamics of recent months have had more to do with rate expectations than with debt, as we reconstructed in the analysis on weaker US data, dollar, and yen.
What to watch, and when
Three appointments will tell if the long end of the curve is stabilizing or not. The first is the Jackson Hole symposium on August 27-29, 2026, where the Federal Reserve's tone on rate prospects will primarily orient the short end. The second is the Federal Open Market Committee meeting on September 15-16: a cut would impact the two-year, but — as all of 2025 showed — it by no means guarantees that the thirty-year will follow. The third, and most important for the theme of this article, is the Treasury's auction calendar and its composition by maturity: if the Treasury shifts issuance towards the short end to avoid long rates, it will ease the immediate cost and swell next year's wall of maturities.
The number to watch is not the next round debt milestone. It is the distance between the 3.447% the Treasury pays on average and the 4.74% the market demands on the ten-year: as long as it remains open, the cost of US debt will continue to rise on its own, one auction at a time, whatever the Federal Reserve decides.
Sources
Total public debt, share held by the public and intragovernmental holdings, with dates of threshold vượt qua, from the daily «Debt to the Penny» report of the U.S. Department of the Treasury (data as of August 20, 2026). Composition of negotiable debt by type and maturity from the «Monthly Statement of the Public Debt», table 3, as of July 31, 2026, aggregating individual identification codes by maturity date; average coupons are weighted by the amount outstanding. Average rate on interest-bearing debt from «Average Interest Rates on U.S. Treasury Securities», July 31, 2026. Gross interest by fiscal year from the «Interest Expense on the Public Debt Outstanding» dataset, latest month available July 2026. Yield curve by maturity from the «Daily Treasury Par Yield Curve Rates» of the US Treasury (August 21, 2026, and closures of December 31, 2024, and 2025). Daily 10- and 30-year yields, ten-year inflation differential, ten-year term premium (Adrian-Crump-Moench model of the Federal Reserve Bank of New York), Federal Reserve's target range for rates, broad dollar index, average rate on US 30-year mortgages, consumer price index, and gross domestic product from the Federal Reserve Bank of St. Louis series (DGS10, DGS30, T10YIE, THREEFYTP10, DFEDTARU, DTWEXBGS, MORTGAGE30US, CPIAUCNS, CPILFESL, GDP, GFDEGDQ188S) and the Bureau of Economic Analysis. Passing of $40 trillion, Wall Street Journal observation on the symbolic value of the figure and reference to historical comparison from ANSA (August 20, 2026) and Sky TG24. 30-year high since 2007, $25 billion auction at 5.216%, July retail sales and producer prices, role of corporate issues related to artificial intelligence, and statement by Anshul Pradhan (Barclays) from Bloomberg and CNBC (August 17-18, 2026). Foreign holdings of US securities, positions of Japan and China, and net flows for June 2026 from Treasury International Capital data of the US Treasury, released August 17, 2026, and reported by Bloomberg. Ten-year yields for Italy and Germany and euro/dollar exchange rate from reference rates and statistics of the European Central Bank. Historical peak of debt/GDP ratio in 1946 and projections on interest spending from the Congressional Budget Office and historical reconstructions of the US federal budget. Calculations on variations, differentials, mortgage rates, and the impact of one percentage point on the stock of negotiable securities are editorial elaborations based on the cited data.
This article is for informational purposes only and does not constitute financial advice, investment research, public solicitation of savings, or a personalized recommendation to buy or sell. The evaluations expressed are the opinions of the editorial staff based on public data as of the publication date and may change without notice. The value of investments can decrease as well as increase, and past performance is not indicative of future results. Before making any investment decision, it is advisable to consult a qualified financial advisor and evaluate the consistency of the operation with one's objectives, time horizon, and risk tolerance.