
On Monday, August 17, 2026, the Japanese yen strengthened by 0.2% against the dollar, to 159.04 per dollar, and the index measuring the greenback against a basket of currencies fell by 0.1%, to 99.501: its lowest level since early June. In the same session, the euro touched 1.1614 dollars, a two-month high. The reason, Reuters reports, is that traders have reduced bets on a Federal Reserve rate hike: Fed funds futures now assign a 30.8% probability to a September hike, compared to 52.2% a week earlier.
It's a movement that should be read in reverse of how it sounds. In 2026, the question for the dollar is not when the Fed will cut, but whether it will have to raise again: the American central bank has kept the cost of money steady in a range between 3.50% and 3.75% for five consecutive meetings (how central banks work), with consumer inflation still at 3.5% annually. What has changed in two weeks is not monetary policy: it is the price the market assigns to future monetary policy. And this, alone, is enough to move an exchange rate.
Three weak data points in two weeks have changed the expected price of money
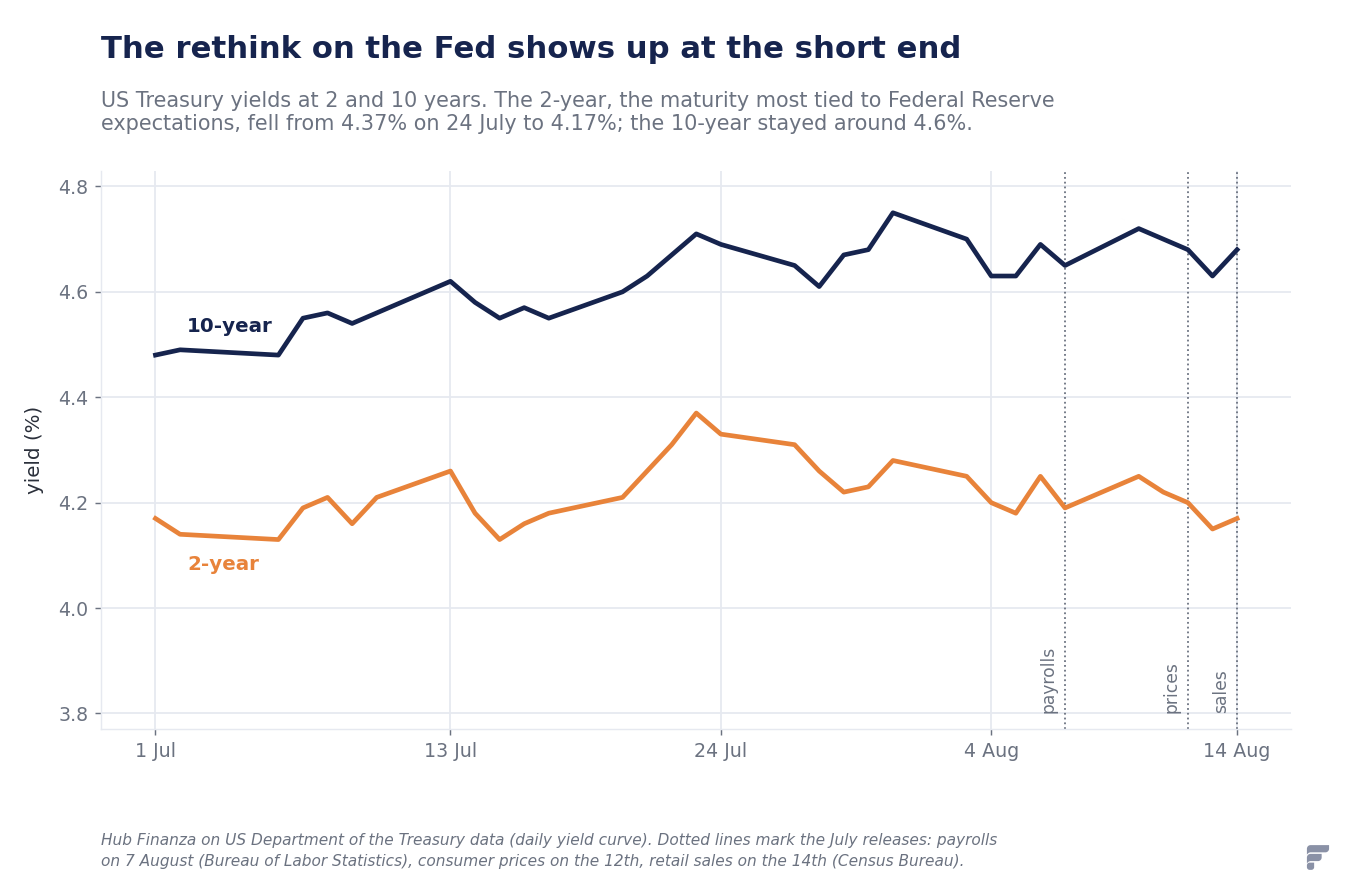
The chain starts with the US data for July, all released between August 7 and 14. The employment report showed a decrease of 23 thousand jobs in non-agricultural sectors, the first decline after months of modest growth (20 thousand jobs had been added in June). Consumer prices rose by 3.5% annually, a clear slowdown from 3.9% in June. Retail sales fell by 0.6% compared to June, to 763.6 billion dollars (the complete July macro picture is in Energy decides July inflation): they remain 5.0% higher than a year earlier, but the monthly sign is negative.
Taken together, the three numbers depict an economy that is slowing down while inflation falls. It is the combination that reduces the urgency to raise rates: a central bank raises the cost of money when it fears that demand is too strong relative to productive capacity, and thus that prices will continue to run. If demand cools on its own and inflation retreats, the argument for tightening weakens. «Weaker US data in recent weeks have reduced rate hike expectations, and less than a full hike is now priced for December», BNY analysts wrote, cited by Reuters.
It should be stated precisely what the data says and what it does not say. The drop in employment concerns the business survey; the household survey, which measures the unemployment rate, recorded a decrease to 4.1% from 4.2% in June in the same month. The two surveys have different methods, and it is not uncommon for them to diverge. Those who read only one number risk reading the wrong month.
Why a changing expectation moves the exchange rate before the Fed moves rates
The passage that most often causes confusion is this: the Federal Reserve did nothing, yet the dollar moved. The reason is that the price of a bond, and therefore its yield, does not reflect today's official rate, but the average of the rates the market expects over the life of the bond. When the probability of a hike decreases, the expected yield over the entire maturity decreases with it — immediately, without waiting for the meeting.
This is clearly seen by looking at two different maturities. The yield on the US two-year Treasury note, the maturity most linked to central bank decisions, fell from 4.37% on July 24 to 4.17% on August 14. The ten-year yield, however, remained around 4.6-4.7%: long-term growth, Treasury funding needs, and the premium required to immobilize money for a long time also weigh on ten years, factors that one month's data shifts little.
From here to the currency, the step is short. Those holding dollars collect the yield offered by dollar assets; if that expected yield falls, the remuneration of that choice decreases, and some capital moves elsewhere. The opposite is also true: expectations of higher US rates make it more convenient to hold dollars and tend to support them. This is the yield channel, and it is the most direct — although, as we will see, it is never the only one in operation.
The differential is the real driver of USD/JPY, and it has narrowed little
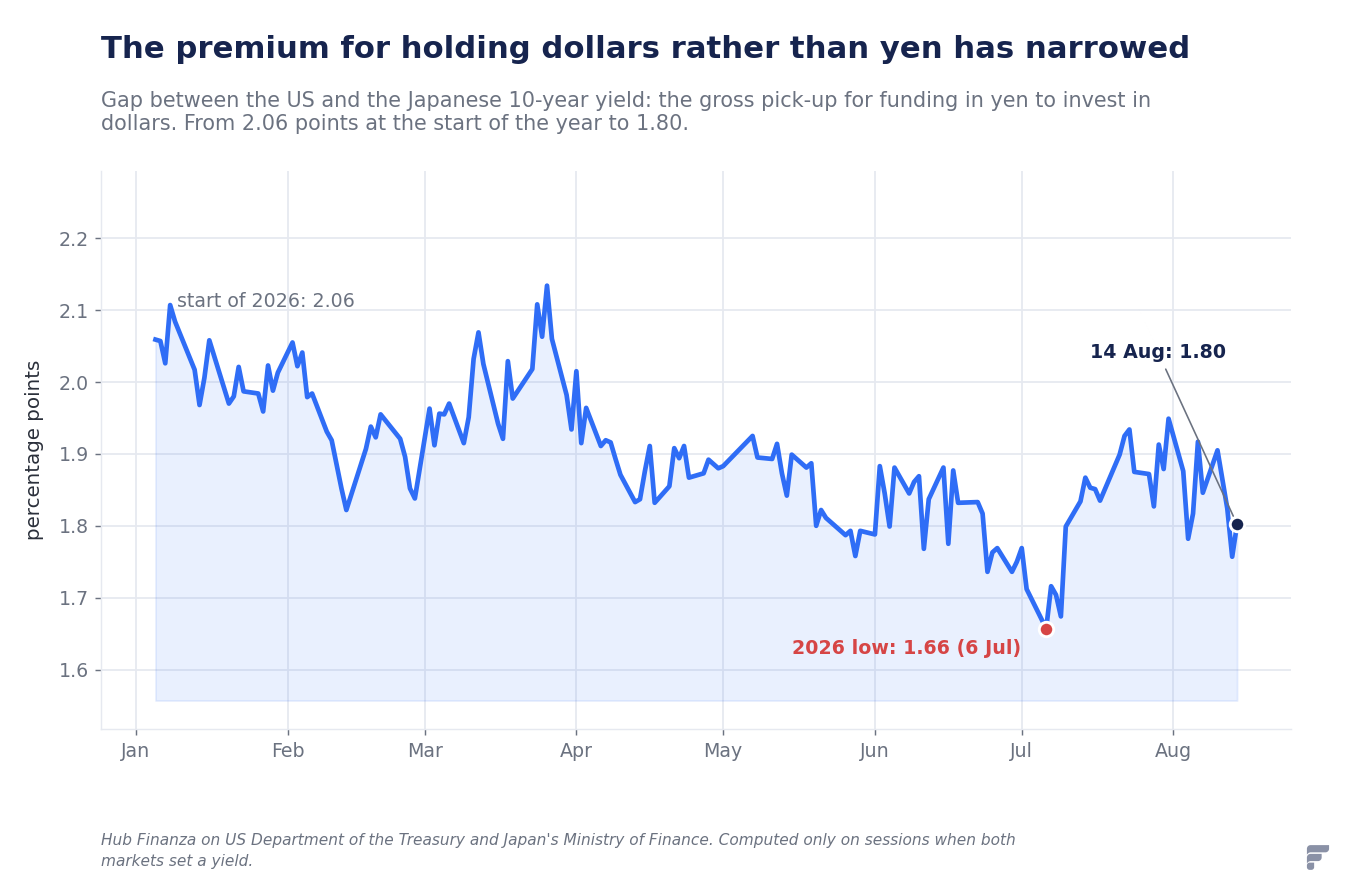
For the dollar/yen exchange rate, however, it is not the absolute US yield that matters: it is the difference between the US yield and the Japanese one. An investor choosing between the two areas compares two remunerations, and what attracts them is the gap. As of August 14, the US ten-year yield was 4.68% and the Japanese one 2.878%: a gap of 1.80 percentage points. At the beginning of January, it was 2.06 points. The mechanism linking the rates of two countries to the price of their currency is explained step-by-step in Monetary policy: what it is, how it works, and why it moves mortgages, bonds, and currencies.
A quarter of a point less in eight months is a real but slow movement, and it explains why the yen has strengthened much less than the rethink on the Fed would suggest. It should be added, for honesty, that the current gap is not even the narrowest of the year: the 2026 low remains 1.66 on July 6. The differential has narrowed, not collapsed.
The Japanese ten-year yields like it did in 1996, and it's still not enough
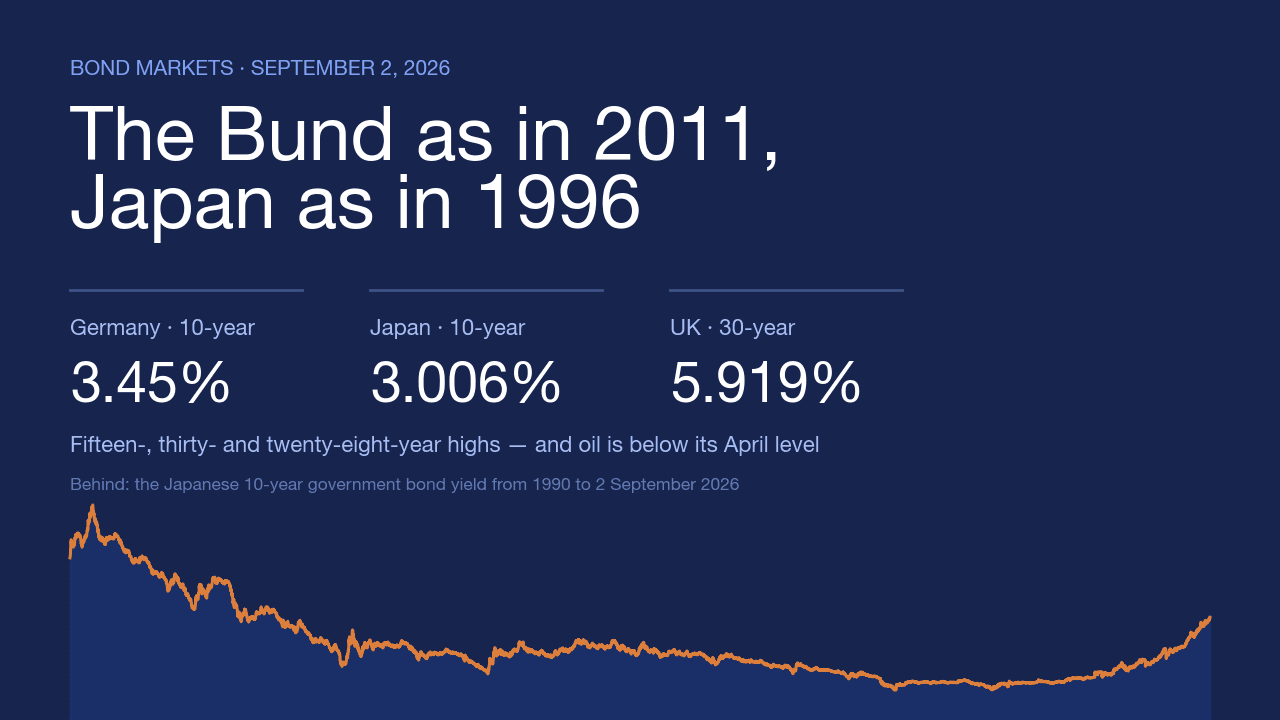
The most profound novelty comes from the other side of the divide. The Japanese ten-year government bond closed on August 14 at 2.878%: on the historical series of the Japanese Ministry of Finance, which starts in 1974, a yield equal to or higher had not been seen since November 12, 1996, when it stood at 2.881%. That's almost thirty years.
The data matters because it debunks a premise that lasted a quarter of a century: Japan as the place where money yields nothing. The Bank of Japan raised the policy rate to 1.0% in June 2026, its highest level since 1995, and long-term yields also rose for fiscal reasons, related to government spending programs. If money in yen starts to yield, the reason to borrow it and take it elsewhere weakens.
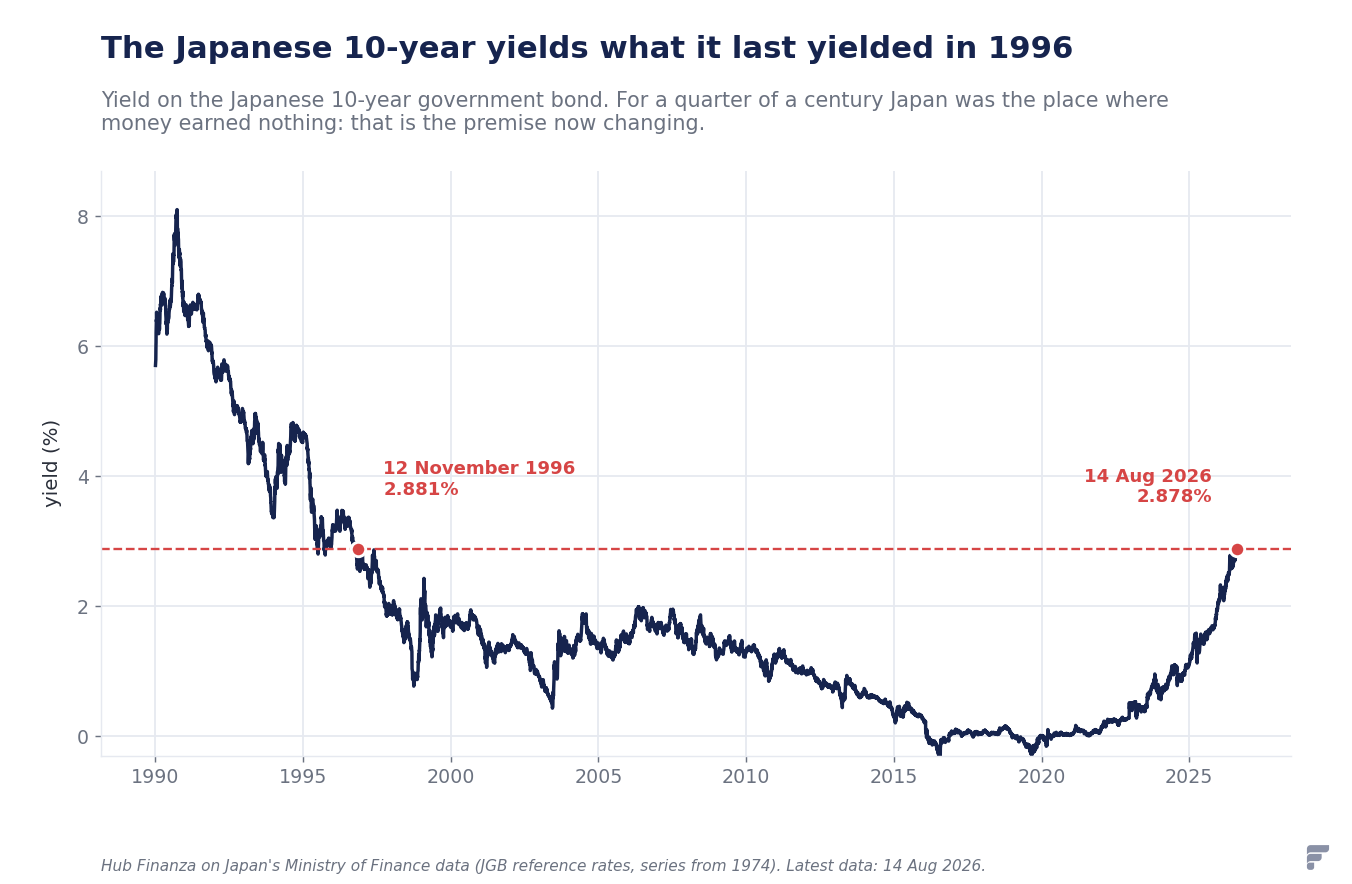
The conditional is necessary: 2.878% remains less than half of the 4.68% American. The direction has changed, the level has not.
The carry trade explains why the yen rises little and could rise sharply
The yield differential not only attracts investors choosing where to put their savings: it also fuels a specific financial operation, the carry trade. This consists of borrowing money in the currency that costs little — for years, the yen — and investing it where it yields more. As long as the gap remains wide and the exchange rate stable, the difference between the two rates is the gain.
This mechanism has an important characteristic: it is asymmetrical. Those who practice it have sold yen to buy dollars, so they also profit from the weakening of the yen; but if the yen strengthens, the loss on the exchange rate can quickly devour the gain on rates. When the weakening is gradual, positions remain open, and pressure on the yen continues. When something scares the market — unexpected data, a jump in volatility, an intervention by authorities — positions close all at once, and closing requires buying back yen. This is why yen recoveries tend to be rare and violent, while its weakenings are slow and regular.
The precedent is three weeks ago, and it's worth reviewing it with the numbers in hand.
First, however, a convention needs to be established, because the dollar/yen exchange rate is read counter-intuitively: it indicates how many yen are needed to buy one dollar. When the number rises, more yen are needed for one dollar, meaning the yen is worth less; when it falls, the yen is strengthening.
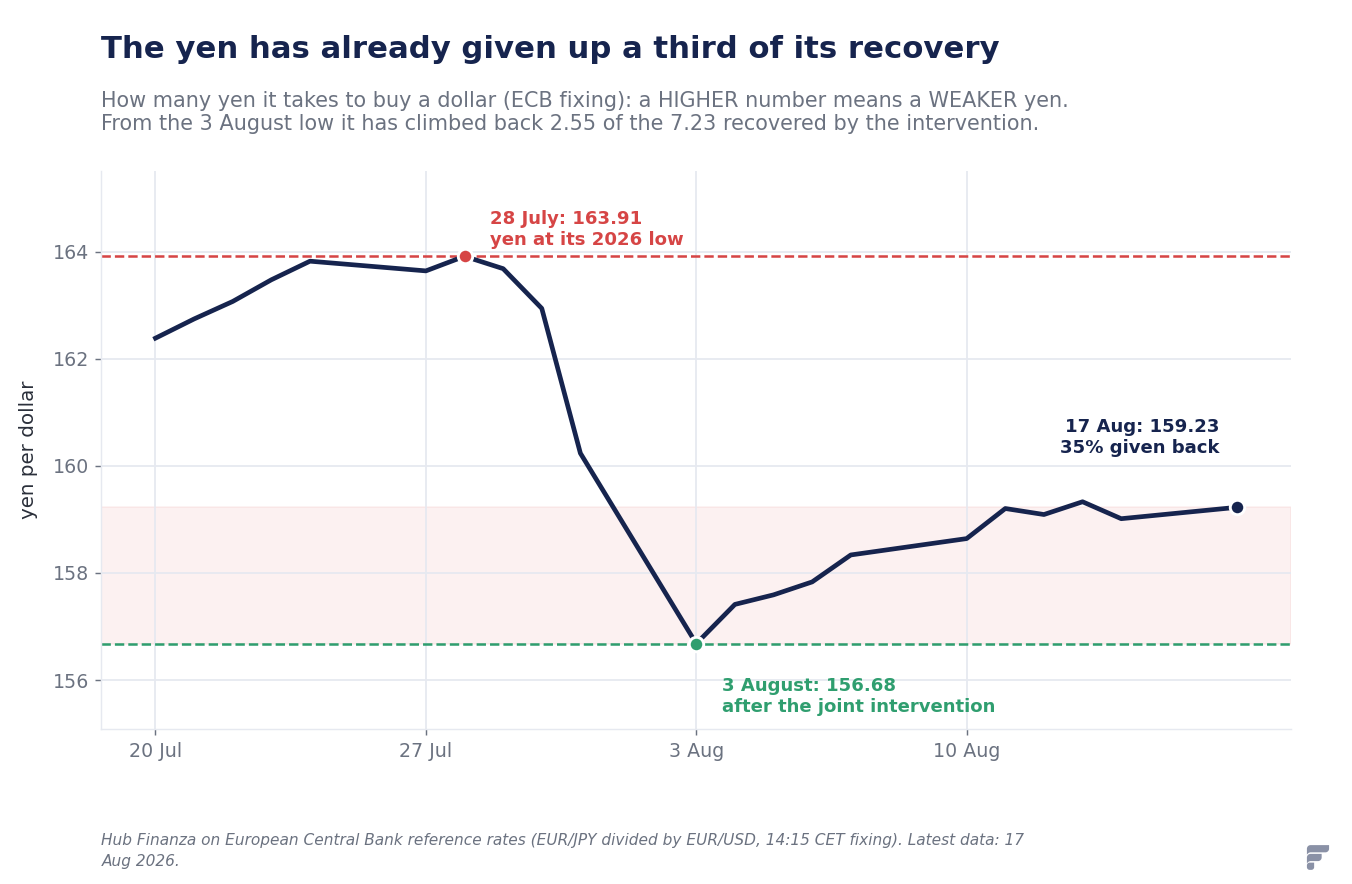
Between July 30 and 31, the Japanese Ministry of Finance and the US Treasury bought yen on the foreign exchange market — for the United States, it was the first such operation since 1998 (the day-by-day reconstruction is in United States and Japan buy yen for the first time since 1998). The effect on the price was immediate: on July 28, 163.91 yen were needed for one dollar, the lowest point ever reached by the Japanese currency on the European Central Bank series; on August 3, 156.68 were enough. Seven yen and twenty-three cents gained in three sessions, the fastest recovery of the year.
Since then, the exchange rate has started to rise again, meaning the yen has weakened again. At the BCE fixing on Monday, August 17, we are at 159.23: compared to the low of August 3, 2.55 yen of the 7.23 recovered, 35%, have already been given back. In two weeks, without anyone intervening a second time, more than a third of the effect has vanished.
This is the reading that matters for understanding the rest: the intervention moved the price for a few sessions, not the economic reason that makes selling yen convenient. That reason is the yield differential, and the differential is still there.
Japanese GDP complicates the Bank of Japan's plans
On the other side of the equation, there is a new constraint. Also on Monday, August 17, the Japanese cabinet office released its preliminary estimate of second-quarter gross domestic product: +0.3% compared to the previous quarter, equivalent to +1.1% on an annualized basis. Traders had expected +0.5% and +2.0% respectively.
The data matters because weaker growth makes it more difficult for the Bank of Japan to continue with hikes: raising the cost of money while the economy slows means slowing it down further. And if the Japanese central bank slows down normalization, the yield gap with the United States closes more slowly — meaning the yen loses the support it was gaining. Here lies the current tension: the Fed pausing pushes the yen upwards, Japanese GDP pulls it downwards.
The Bank of Japan, at its July meeting, left the rate at 1.0%, indicating it is assessing the effect of the weak yen on prices and growth; in the summary of opinions published on August 10, a member observed that the pace of hikes could be faster than the market expects. Economists' forecasts remain divided between October and December. It is an expectation, not a fact: no date has been announced.
Why «rates up, currency up» is not a law
The mechanism described so far is the most important, but it must be handled knowing its limitations. The yield that matters for an investor is the real one, net of inflation: a country that raises rates while prices run higher may still see its currency weaken. In times of financial tension, safety and liquidity matter more than yield, and capital moves towards the dollar or yen regardless of rates. Other factors include market positioning — when almost everyone is on the same side, a few news items are enough to reverse the price —, trade policy, flows related to Japanese household savings, and, as seen, the willingness of authorities to intervene.
Monday's case illustrates this itself: the dollar loses against all major currencies and reaches its lowest levels since June, but against the yen it remains stronger than ten days earlier. The same rethink on the Fed produces different outcomes depending on the currency it is compared with.
Seen from Europe, the yen has not moved this year
There is a simple way to understand how much the yardstick used to measure a currency matters. The entire story told so far concerns the relationship between the dollar and the yen. But an Italian saver does not buy yen with dollars: they buy them with euros. And in euros, the picture is different.
At the European Central Bank's fixing on Monday, August 17, one euro was worth 184.59 yen. On January 2, it was worth 183.94. In seven and a half months, for those looking from Frankfurt, the yen has moved by just 0.4% — despite having touched 187.72 on April 17, its highest value since the BCE began publishing the series in 1999. In the same period, the euro lost 1.1% against the dollar, and the recent weakness of the greenback brought it back to 1.1593 dollars, its highest level since mid-June.
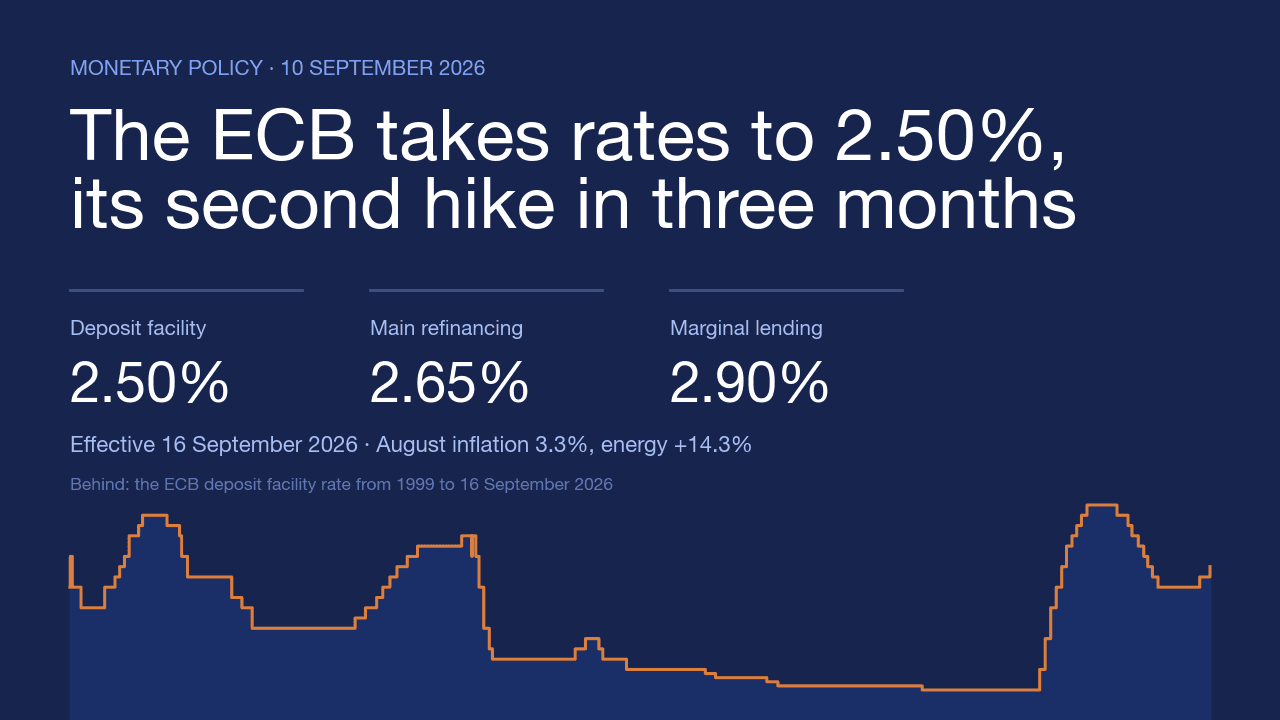
The lesson is that there is no such thing as "the strength" of a currency in absolute terms: it only exists relative to another. The yen has weakened significantly against the dollar because the yield gap with the United States is wide; much less against the euro, because the European Central Bank keeps its deposit rate at 2.25%, much closer to the Japanese 1.0% than to the American 3.50-3.75%. Anyone reading an exchange rate must always ask what the term of comparison is: by changing it, the story changes.
What to watch, and when
Three close appointments will tell if the movement has solid foundations. From August 27 to 29, the Jackson Hole symposium, organized by the Federal Reserve of Kansas City, will be held: it will be the first opportunity there for Kevin Warsh, Fed chairman since May 22, 2026, to indicate how he intends to react to the data. The scarcity of recent indications is itself a factor of uncertainty — «Ask ten people what their Fed rate forecast is and you’ll probably get twenty different answers», analyst Thomas Simons observed, cited by Reuters.
Following this are the Federal Reserve meeting on September 15 and 16, which also brings with it an update of the committee members' economic projections, and the Bank of Japan meeting on September 17 and 18: two decisions two days apart, on both sides of the same differential. At the end of August, finally, the Japanese Ministry of Finance will publish the monthly totals of interventions on the foreign exchange market: it will be the first official data on the amount spent at the end of July, so far known only by estimates.
The variables to follow, in order of relevance for the exchange rate, are the differential between ten-year yields, the American two-year yield as a measure of Fed expectations, the probabilities implied in Fed funds futures, and the US employment and price data for August, due in September.
Sources
Market levels on August 17, 2026 — dollar/yen exchange rate at 159.04, dollar index at 99.501, euro at 1.1614 dollars — and implied probabilities in Fed funds futures (30.8% for a September hike versus 52.2% the previous week, based on CME FedWatch data; in an earlier version of the day, 69.9% probability of rates remaining unchanged versus 47.6% a month earlier) from Reuters, dispatches from August 17, 2026, picked up by Yahoo Finance and Investing.com; in the same source, the citation of BNY analysts and analyst Thomas Simons. Federal Reserve interest rate range at 3.50-3.75% from Federal Open Market Committee communiqués. US employment, consumer prices, and retail sales for July 2026 from official series of the Bureau of Labor Statistics and the Census Bureau, consulted through the FRED database of the Federal Reserve Bank of St. Louis: non-farm employment down 23 thousand units, unemployment rate at 4.1%, consumer price index at +3.5% annually, retail sales at 763.6 billion dollars (−0.6% monthly, +5.0% annually). US Treasury bond yields from the daily curve of the US Department of the Treasury. Japanese government bond yields from the reference rates of the Ministry of Finance of Japan, historical series from 1974: the 2.878% on August 14, 2026, is the highest level since November 12, 1996 (2.881%), verified over the entire series. Daily dollar/yen exchange rate, euro/dollar and euro/yen exchange rates from the European Central Bank's reference rates (dollar/yen as a ratio between EUR/JPY and EUR/USD); ECB deposit rate at 2.25% from the same source. Japanese gross domestic product for the second quarter of 2026 (+0.3% quarter-on-quarter, +1.1% annualized, against expectations of +0.5% and +2.0%) from the preliminary estimate of the Japanese cabinet office, picked up by CNBC and Xinhua. Bank of Japan policy rate at 1.0% since June 2026 and summary of opinions from the July meeting, published August 10, from the Bank of Japan and The Japan Times. Joint intervention on July 30-31, 2026, and first US purchase of yen since 1998 from CNBC, Al Jazeera, and communiqués from the Japanese Ministry of Finance and the US Treasury, already reconstructed in Hub Finanza's analysis of August 7, 2026. Dates for Jackson Hole (August 27-29) and Federal Reserve (September 15-16) and Bank of Japan (September 17-18) meetings from the official calendars of the respective institutions. Appointment of Kevin Harold Warsh as Chairman of the Federal Reserve, in office since May 22, 2026, from the communiqués of the Board of Governors. Calculations on differentials, proportions of recovered gains returned, and variations are elaborations by the editorial team based on the cited data.
This article is for informational purposes only and does not constitute financial advice, investment research, a solicitation for public savings, or a personalized recommendation to buy or sell. The assessments expressed are the opinions of the editorial team based on public data as of the publication date and may change without notice. The value of investments can decrease as well as increase, and past performance is not indicative of future results. Before making any investment decision, it is advisable to consult a qualified financial advisor and evaluate the consistency of the operation with one's objectives, time horizon, and risk tolerance.