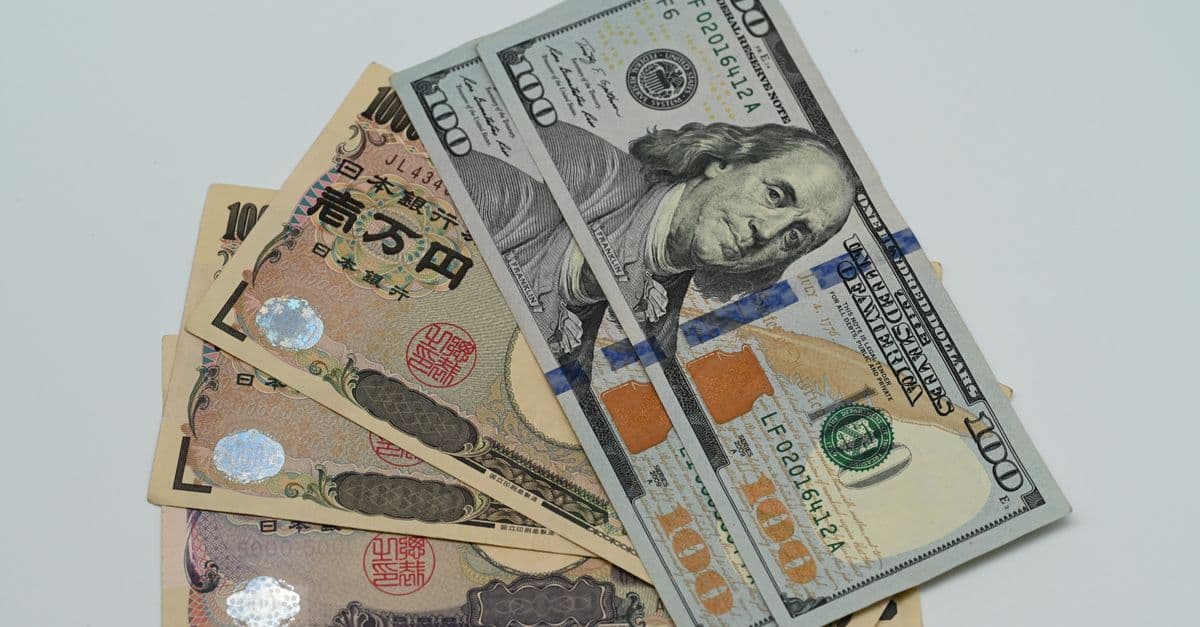


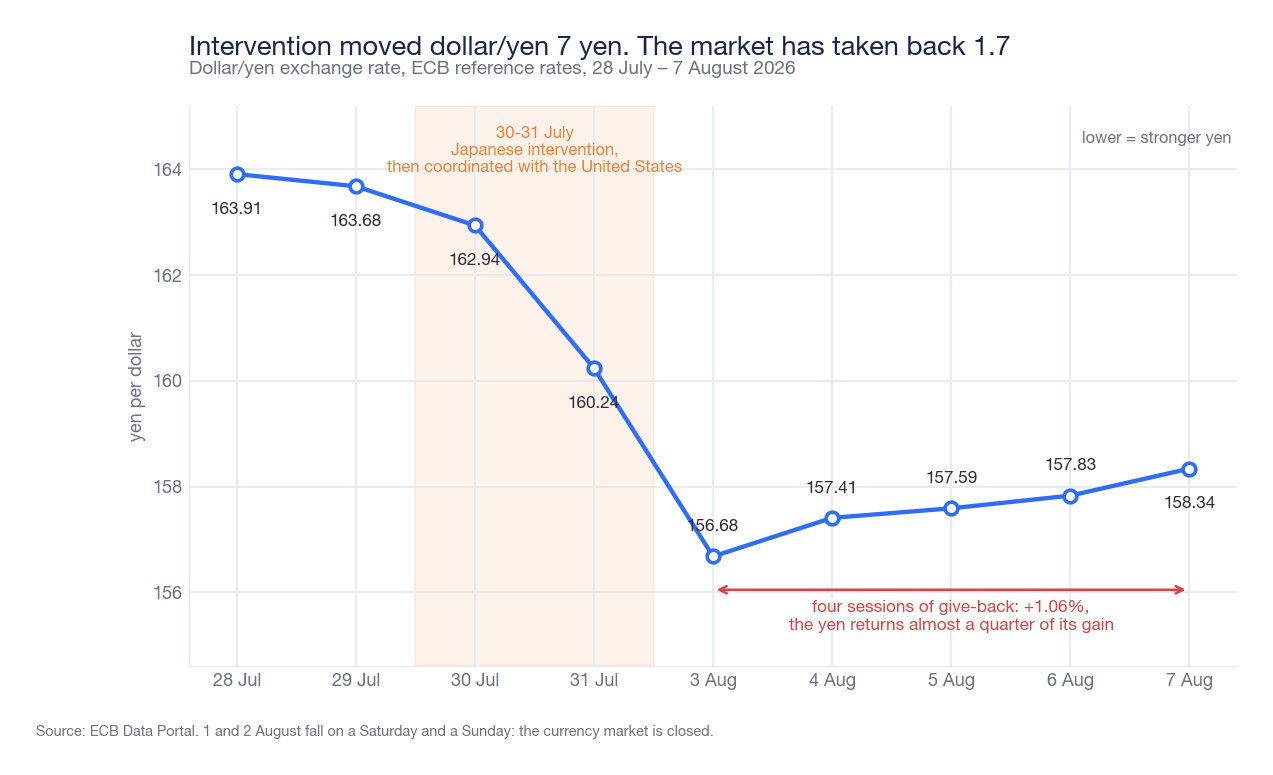
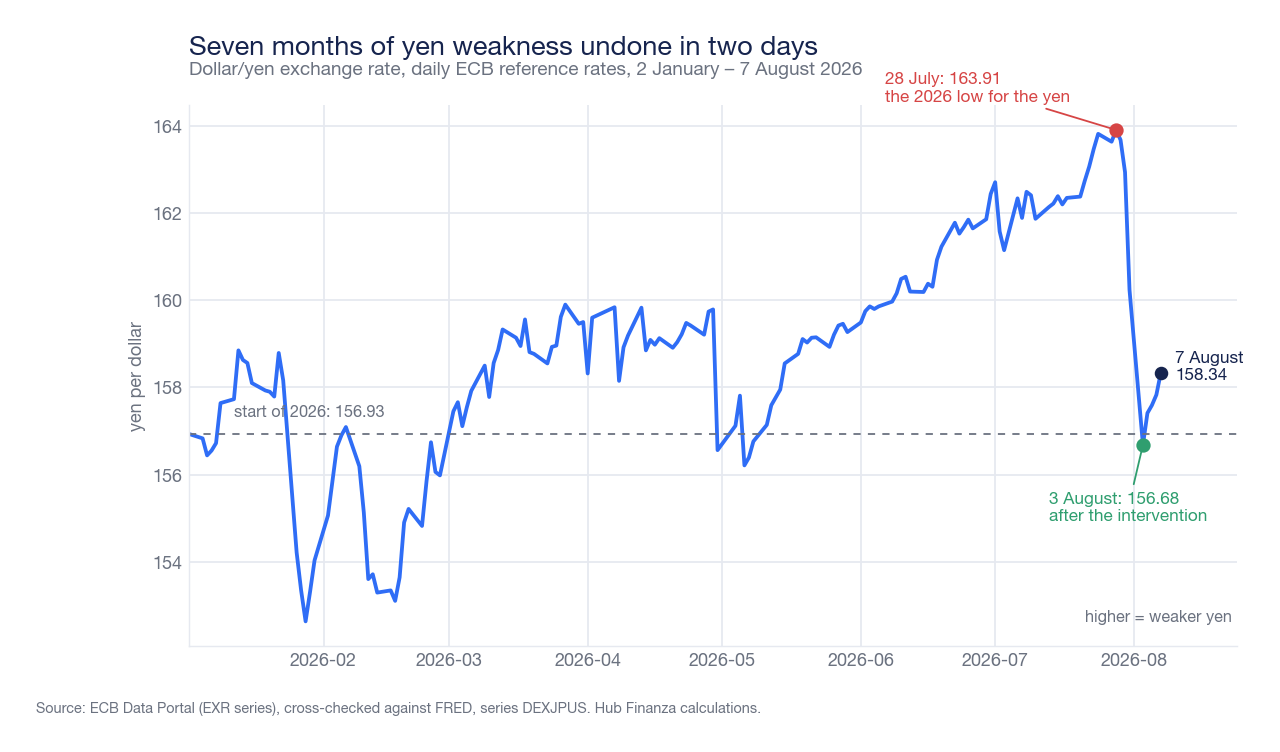
On July 31, 2026, the United States Treasury bought yen on the foreign exchange market for the first time since 1998, joining a Japanese intervention that began the day before. In the space of three sessions, the dollar/yen exchange rate moved from 163.91 to 156.68, seven yen and twenty-three cents: the most violent movement of the year. At the close of Friday, August 7, the European Central Bank's fixing was 158.34.
The yen, in other words, has already given back 1.66 of the seven yen gained: almost a quarter of the recovery, in four consecutive sessions of weakening. Compared to January 2, the Japanese currency remains 0.9% weaker against the dollar, and in the last session of the week, the exchange rate resumed its movement only because the American employment report for July came out worse than expected. This is the data that summarizes the problem: it was not the intervention that durably moved the yen, but American monetary policy.
The sessions: what happened, day by day
The yen had reached its yearly lows at the end of July. On July 28, the BCE fixing was 163.91 yen per dollar, the weakest point of 2026; on the Federal Reserve Bank of St. Louis series, which records the exchange rate at noon New York time, the high was on July 29 at 163.86. The two series differ by recording time, not by substance: the BCE fixes at 2:15 PM Frankfurt time, before the American opening.
On Thursday, July 30, the exchange rate collapsed. On the St. Louis Fed series, the session closed at 159.47, with a daily change of −2.68%: the largest decline recorded in 2026, ahead of −2.34% on January 26 and −2.23% on April 30, both days on which Japan had intervened. On Friday, July 31, the second action arrived, this time declared and coordinated with Washington. On Monday, August 3, upon reopening, the BCE fixing reached 156.68.
| Session | BCE fixing | Change | What happened |
|---|---|---|---|
| Tuesday, July 28 | 163.91 | +0.17% | yen at 2026 lows |
| Wednesday, July 29 | 163.68 | −0.14% | — |
| Thursday, July 30 | 162.94 | −0.45% | Japanese intervention, unconfirmed |
| Friday, July 31 | 160.24 | −1.66% | Coordinated United States-Japan intervention; BOJ meeting |
| Monday, August 3 | 156.68 | −2.22% | yen's peak strength |
| Tuesday, August 4 | 157.41 | +0.47% | reversal begins |
| Wednesday, August 5 | 157.59 | +0.11% | — |
| Thursday, August 6 | 157.83 | +0.15% | — |
| Friday, August 7 | 158.34 | +0.32% | USA labor data below expectations |
August 1 and 2 fell on Saturday and Sunday: the foreign exchange market was closed, and the American confirmation arrived during those hours. On Friday, August 7, after the fixing, the exchange rate dropped to 156.65 on the back of the employment report, then rose again: at 4:30 PM Italian time, it was trading around 157.8. On an intraday basis, Bloomberg calculates that the yen has given back almost half of the intervention's gains; on official fixings, which ignore the day's lows and highs, the portion given back is 23%. The two measures are not contradictory: they describe the same retracement using two different metrics.
Who really intervened, and with how much
The distinction between the two days matters, and it must be maintained. July 30 is a movement with strong suspicion of unilateral Japanese intervention, never officially confirmed. July 31 is a coordinated intervention, confirmed by both parties: the Federal Reserve Bank of New York acted on behalf of the US Treasury by selling euros from American reserves and buying yen with the proceeds.
This latter detail has drawn the harshest criticism. Selling a third currency instead of dollars is technically unusual, and several former officials have said so publicly: Edwin Truman, formerly at the Treasury, called the operation "weird," arguing that selling a third currency is not as effective as selling dollars; Mark Sobel judged it imprudent because it does not address the causes of the yen's weakness; Robin Brooks, of the Brookings Institution, warned that the risk is giving the market reasons to ask questions.
Regarding the amounts, it is important to be explicit about what is known and what is not. Neither figure is official. For the Japanese side, Bloomberg estimates approximately 8,450 billion yen (around 52.8 billion dollars) by comparing the Bank of Japan's accounts with monetary operators' forecasts; other reconstructions, reported by Al Jazeera, indicate up to 59 billion dollars. If the lower estimate were confirmed, it would still be the largest single day of intervention ever carried out by Tokyo, surpassing the 6,280 billion yen on April 30, 2026. For the American side, the only public clue is a photograph of a notepad in front of Treasury Secretary Scott Bessent during a cabinet meeting on July 31, with "Buy Japanese Yen $5-10 bil" annotated: an order-of-magnitude indication, not a datum.
The actual number will arrive at the end of August. The Japanese Ministry of Finance publishes monthly intervention totals and daily details on a quarterly basis; the operations of July 30 and 31 fall within the reporting period of July 27 – August 26, 2026. Japanese foreign exchange reserves at the end of July were substantially unchanged from the previous month, suggesting that the operation is not yet reflected in the accounts.
Historically, the episode is rare, but it must be dated precisely because the two things are often confused. The last time the United States had bought yen was in 1998, during the Asian financial crisis. The last coordinated intervention in which they participated together with Japan was in March 2011, when the G7 acted in the opposite direction — selling yen to weaken it — after the earthquake and tsunami. Buying yen together, therefore, had not happened for twenty-eight years.
As for the statements, Bessent justified the action with the yen's "substantial undervaluation," stating that the United States strongly supports the measures decided by Tokyo, and added on August 4 that "a stable yen is not only important for the United States, but it is very important for the entire region," citing the risk that an excessively weak Japanese currency could push other Asian countries to devalue. The reference to "disorderly movements" and "excessive volatility" appears instead in the note from the Japanese Ministry of Finance: this is the formula with which Tokyo habitually justifies its interventions.
The gap that makes the yen the currency to sell has not closed
The yen's weakness has a simple structural cause: it yields little to hold it. The carry trade is the mechanism by which an investor borrows a low-interest currency, sells it, and invests the proceeds in assets denominated in a high-interest currency, collecting the difference. As long as the gap remains wide and the exchange rate stable, the operation is profitable; when the exchange rate moves sharply against those who set it up, the losses arrive all at once.
Here, a common misconception needs to be corrected. In 2026, the differential between the United States and Japan did not narrow uniformly: it depends on the maturity, and on the maturity that matters most for the carry trade, it moved in the opposite direction.
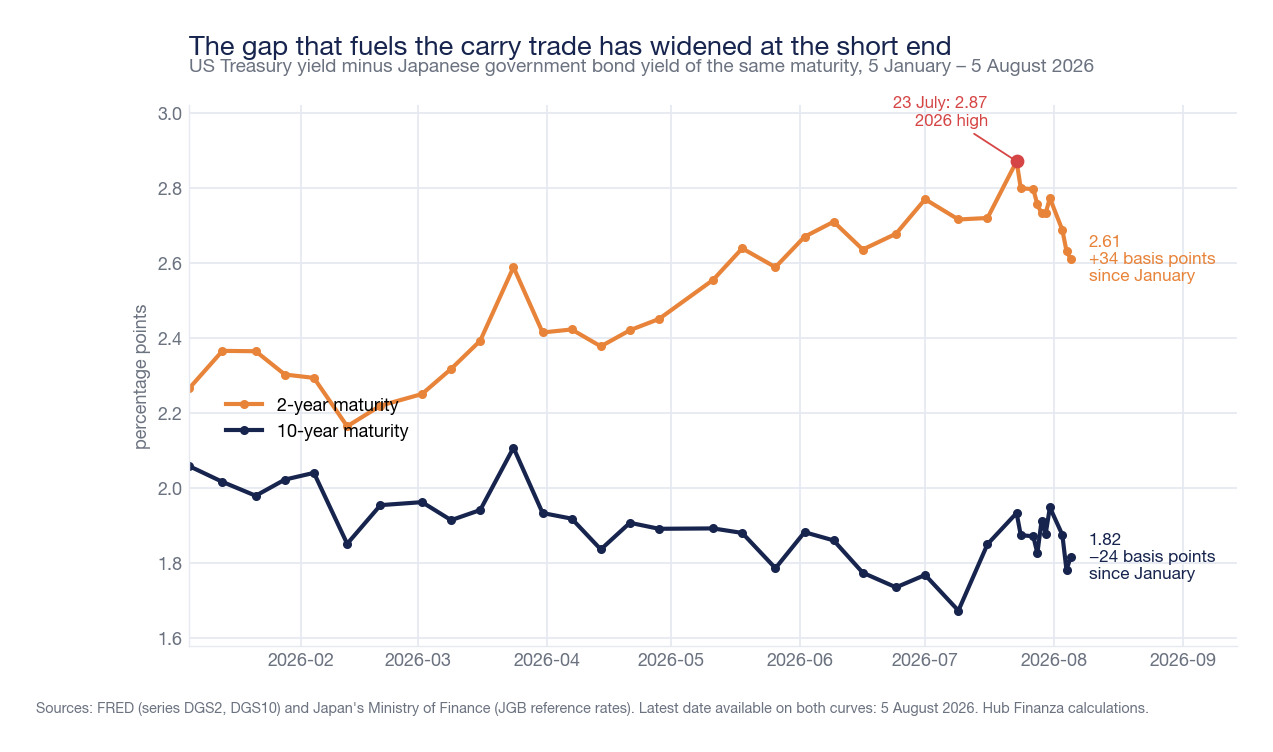
On the two-year maturity, the one most sensitive to monetary policy expectations, the differential rose from 2.27 percentage points on January 5 to 2.61 on August 5: it widened by 34 basis points, after reaching the year's high of 2.87 on July 23, three sessions before the intervention. On the ten-year maturity, however, it fell from 2.06 to 1.82 points, meaning 24 basis points less, because during the same period the Japanese bond yield rose more than the American one: +70 basis points versus +46.
The reason is that the two countries are moving asymmetrically. The Bank of Japan has raised rates; the Federal Reserve has not. The American cost of money has been stable in a range between 3.50% and 3.75% since December 2025 — when it was cut — and has not moved since. Despite this, the two-year Treasury yield has risen by 71 basis points since the beginning of the year, to 4.18% on August 5: the market stopped expecting cuts and began to price in the opposite hypothesis. The American ten-year is at 4.63%, up 44 basis points from January.
In the last week, however, the picture began to turn: between July 31 and August 5, the differential narrowed by 16 basis points on the two-year and 13 on the ten-year, because American yields fell. This, more than the intervention, is the channel through which the yen can strengthen stably.
The Bank of Japan raises rates, but inflation is still below target
On July 31, the same day as the coordinated intervention, the Bank of Japan left the uncollateralized overnight call rate around 1.0%, the highest level since 1995, following the 25 basis point hike decided in June. The decision passed with eight votes against one: Board member Hajime Takata voted against, asking to immediately raise the rate to 1.25%, believing that the phase requires a more reactive approach to upside price risks.
In the Outlook Report published the same day, the central bank predicts that core inflation will be "clearly above" 2% from the second half of fiscal year 2026, and raised its growth estimate for the year to +0.6% from +0.5%.
Here, a clarification is needed that changes the meaning of Japanese monetary policy: the BOJ's is a forecast, not a snapshot of the present. Realized inflation is still below target. In June 2026, the national consumer price index rose by 1.7% year-on-year, and the core component, excluding fresh food, by 1.6%: below 2% for the fifth consecutive month. The Tokyo data for July, which precedes the national data, shows +1.9%, accelerating for the second month and at its highest since January, but still below target. The central bank is therefore normalizing rates in advance of observed inflation, counting on wages and the exchange rate to push it above 2%.
On wages, the picture is solid but slightly cooling. The spring 2026 negotiations — the shuntō — concluded, according to the definitive report by Rengo, the largest trade union confederation, with an average increase of 5.01% across 5,368 companies, equivalent to approximately 16,400 yen per month. This is the third consecutive year above 5%, but the result is lower than 5.25% in 2025; in companies with fewer than 300 employees, the increase is limited to 4.69%.
The Japanese government bond yield curve reflects higher expected rates. As of August 6, 2026, it rises steadily up to the twenty-five-year maturity, then flattens and slightly inverts on the very long end.
| Maturity | Yield | Maturity | Yield |
|---|---|---|---|
| 1 year | 1.311% | 9 years | 2.629% |
| 2 years | 1.565% | 10 years | 2.773% |
| 3 years | 1.709% | 15 years | 3.340% |
| 4 years | 1.893% | 20 years | 3.659% |
| 5 years | 2.044% | 25 years | 3.945% |
| 6 years | 2.176% | 30 years | 3.919% |
| 7 years | 2.319% | 40 years | 3.912% |
| 8 years | 2.490% |
Speculators were short at a record high, and in one week they closed everything
Every Tuesday, the Commodity Futures Trading Commission photographs open positions on futures traded in Chicago and publishes them the following Friday. Two surveys have been released that tell the story of the intervention from start to finish: that of July 28, taken before the collapse of July 30 and the coordinated action of July 31, and that of August 4, the first after.
On the eve, non-commercial operators — large speculators, funds, and managers above reporting thresholds — were massively positioned against the yen: 101,271 long contracts versus 264,683 short, a net short position of 163,412 contracts. Each contract is worth 12.5 million yen, so the aggregate bet against the Japanese currency was worth approximately 2,043 billion yen, almost 13 billion dollars. Short sales alone accounted for 61.2% of the entire open interest, compared to 23.4% of long positions. It was the shortest position of all 2026, and it had deepened precisely in the last week: on July 21, the net short was 152,125 contracts.
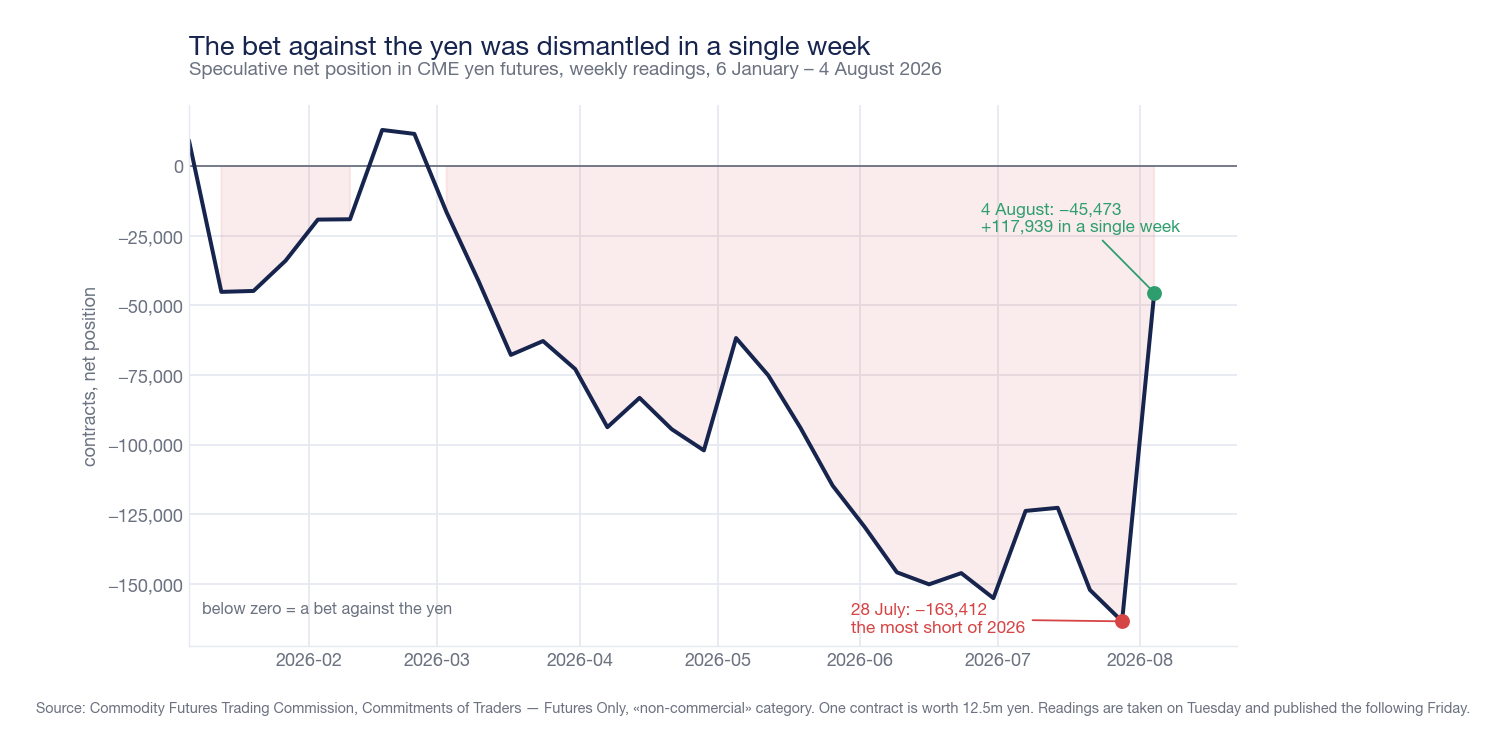
A week later, that bet is gone. As of August 4, longs rose to 147,228 and shorts collapsed to 192,701: the net short decreased to 45,473 contracts. In seven days, speculators closed 71,982 downside contracts and opened 45,957 upside contracts, for a net change of 117,939 contracts — 72% of the previous position, and the largest weekly movement of 2026, more than double the second largest. The value of the bet against the yen dropped from 2,043 to 568 billion yen, from almost 13 to 3.6 billion dollars. Overall open interest decreased by 12,973 contracts, to 419,393: positions were not reversed, they were closed.
This confirms the mechanics of the sharp move, no longer a hypothesis. A surprise intervention against such a unilaterally positioned market does not merely shift the exchange rate with its own purchases: it forces those who were short to buy back, and the repurchase amplifies the movement. The seven yen gained between July 28 and August 3 are not the price of what Tokyo and Washington bought, but of that plus everything speculators had to buy back to avoid remaining exposed.
The data also helps interpret the subsequent sessions. If part of the yen's rise was forced covering, that impetus runs out when the coverings end — and that is exactly what has been seen from August 4 onwards, with the currency resuming its weakening for four consecutive sessions while positioning was now neutralized.
A divergence within the data should also be noted, as it is instructive. Small operators below the reporting thresholds moved in the opposite direction to professionals: they were net long by 5,387 contracts on July 28 and returned to net short by 5,095 contracts on August 4, buying yen before the intervention and selling it afterward. This is a marginal category, below 10% of open interest, and should not be confused with professional speculators, who did the exact opposite on both occasions.
Strong yen and strong stock market together: the traditional link did not work
There is one last anomaly, and it deserves to be presented for what it is. In the July 31 session, while the yen strengthened, the Nikkei 225 rose by 4.03%, from 61,867 to 64,362 points. On August 5, it reached 66,300 points with another +3.66%. From July 29 to August 7, the index gained 6.8% while the yen strengthened by 3.4%: the two moved together, when the rule would dictate the opposite, because a weak yen inflates the profits of Japanese exporters converted into national currency.
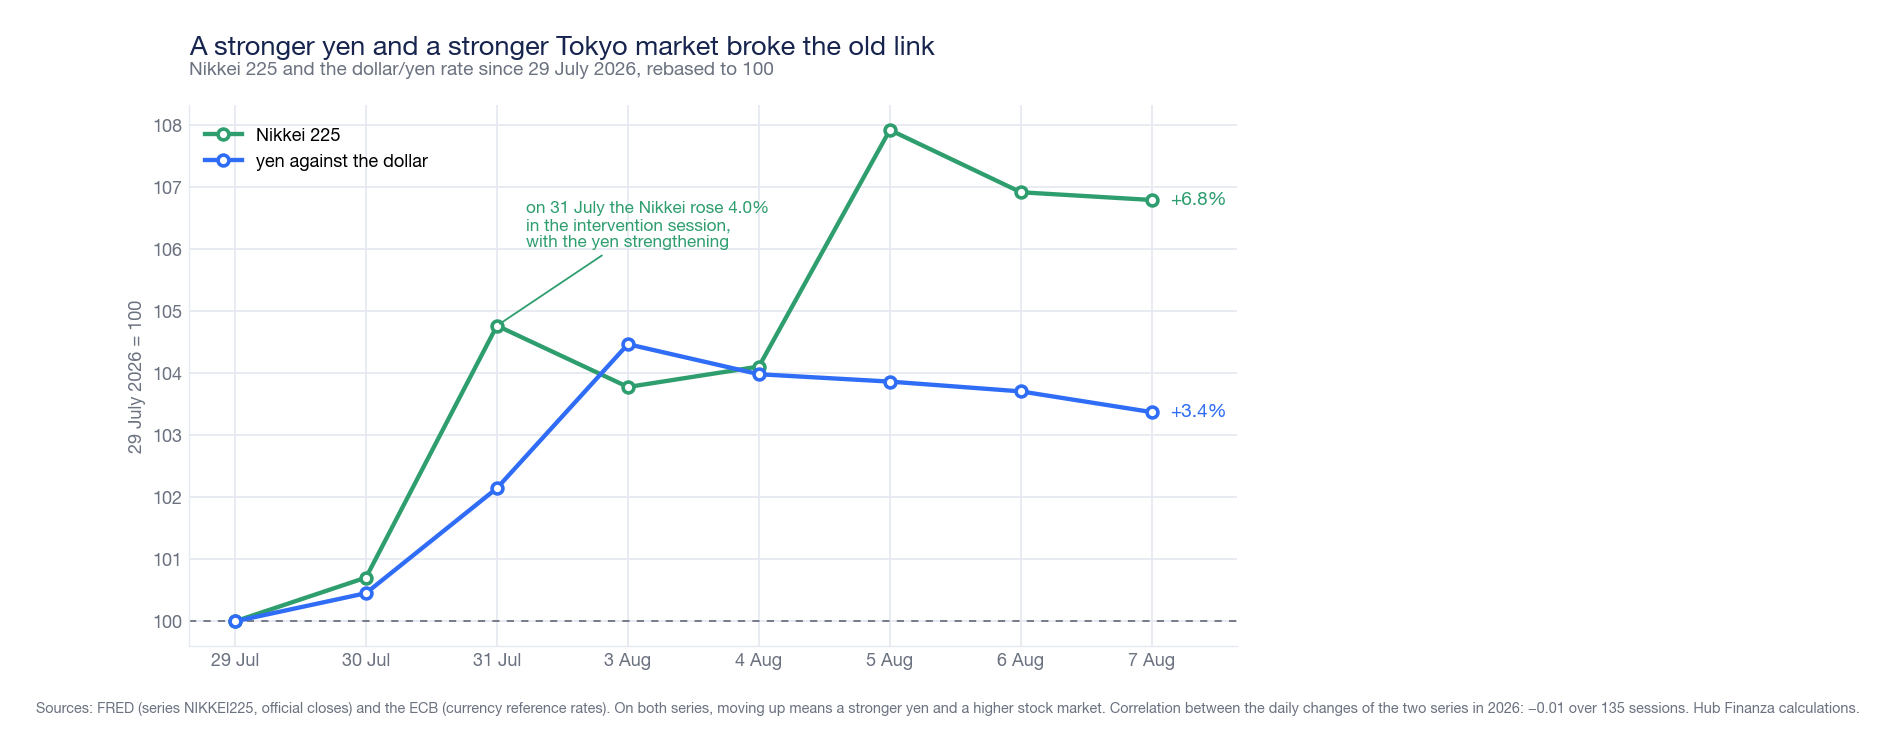
The measured data is clear: the correlation between daily changes in the dollar/yen exchange rate and those of the Nikkei 225 in 2026 is −0.01 over 135 sessions, meaning it is indistinguishable from zero. But it must be said with statistical honesty that the link was not strong even before: calculated on the same official series, the correlation between daily changes was +0.20 in 2023, +0.23 in 2024, and +0.11 in 2025. We are not observing the breaking of a law, but the exhaustion of an already weak trend, and on a daily horizon — over longer periods, the relationship between exchange rate and earnings remains relevant.
Possible explanations remain hypotheses, and as such should be treated: that the Japanese stock market is pricing in the end of deflation more than competitive devaluation; that the intervention was read as a factor of stability and not tightening; that the impetus comes from sectors not very exposed to the exchange rate. None of these interpretations are proven by the available data.
Finally, a note of proportion that the rally of recent days risks obscuring: the Nikkei closed on August 7 at 65,606.71 points, up 26.6% year-to-date but still 9.3% below the high of 72,366.34 points reached on June 25, 2026. The rebound of the last week is a partial recovery, not a new record.
What to watch, and when
The lesson of the last five sessions is that an intervention moves the price, not the reason why the price was moving. As long as the yield differential remains above two and a half points on the two-year maturity, the incentive to sell yen does not disappear. Three concrete appointments will tell if the picture changes.
The positioning of speculators, which the August 4 data has already nullified as a pressure factor. With the net short having fallen from 163,412 to 45,473 contracts, the mechanical upward pressure on the yen — the forced repurchase by those who were uncovered — is largely exhausted. The August 11 survey will tell if speculators are repositioning against the Japanese currency, which is the acid test for the intervention's sustainability.
The official amount of the Japanese intervention, expected at the end of August 2026 with the monthly publication by the Ministry of Finance relating to the period July 27 – August 26. This will confirm or deny the estimate of 8,450 billion yen and will indicate how much Tokyo is willing to spend: in the April 28 – May 27 cycle, it committed 11,730 billion yen, approximately 73 billion dollars, the highest total ever recorded.
American data on prices and labor, which remain the true driver of the exchange rate. The July employment report, published on Friday, August 7, showed a decline of 23,000 jobs compared to expectations for an increase of 83,000, with downward revisions of 103,000 jobs for the previous two months, an unemployment rate of 4.1%, and hourly earnings growing at 3.2% annually, the slowest pace since May 2021. This is the kind of data that, if repeated, reduces the interest rate differential and supports the yen more than any market purchase.
On the Japanese front, the two elements to monitor are inflation — which must rise above 2% to justify the hikes already made — and the next Bank of Japan meeting, where Takata's vote indicates that there is already a minority in favor of tightening faster. If inflation were to surprise on the downside while the Federal Reserve remains steady, the yen would come under pressure again, and the cost of the July 31 intervention would prove to have been spent only to buy time.
Finally, as of the publication date, data on implied volatility of dollar/yen options, foreign investor flows in the Japanese market, and currency hedging by pension funds are not publicly available: these are the elements that would allow measuring how much the market expects a new intervention, and they are not hypothesized in this article.
Sources
Dollar/yen exchange rate from European Central Bank reference rates (Data Portal, series EXR: EUR/JPY divided by EUR/USD, 2:15 PM CET fixing), cross-referenced with the DEXJPUS series from the Federal Reserve Bank of St. Louis, which records the exchange rate at noon New York time and is updated to July 31, 2026. Intraday values for August 7 from Yahoo Finance. Nikkei 225 from the NIKKEI225 series of the Federal Reserve Bank of St. Louis (official closings, last data August 7, 2026). Japanese government bond yields from the jgbcm file of the Japanese Ministry of Finance (August 6, 2026); Treasury yields from the DGS2 and DGS10 series and American cost of money from the DFEDTARU and DFEDTARL series of the Federal Reserve Bank of St. Louis (August 5, 2026). Operator positioning from the Commitments of Traders — Futures Only of the Commodity Futures Trading Commission, surveys of July 28 and August 4, 2026, "non-commercial" category; the 2026 weekly series from the annual archive of the same source, with the last two surveys cross-referenced on the weekly report and coinciding figure for figure. Monetary policy decision, vote breakdown and Outlook Report from Bank of Japan communiques of July 31, 2026. Consumer price index from the Japanese Statistics Bureau (June 2026) and Tokyo July 2026 survey. Definitive outcome of the 2026 shuntō from the Rengo final report of July 3, 2026, reported by Japan Times and Nippon.com. Intervention chronicle, official confirmations, statements, and amount estimates from Bloomberg, CNBC, Al Jazeera, Axios, Fortune, and Nikkei Asia (July 30 – August 7, 2026); official amounts of April-May 2026 interventions from the Japanese Ministry of Finance, reported by Nikkei Asia and Japan Times. July 2026 employment report from the Bureau of Labor Statistics (August 7, 2026). Estimates of the amounts of the July 30 and 31 interventions are not official data and are indicated as such in the text. The calculation of the correlation between exchange rate and Nikkei, yield differentials, and retracement percentages are editorial analyses based on the official series cited.
This article is for informational purposes only and does not constitute financial advice, investment research, public solicitation for savings, or a personalized recommendation for purchase or sale. The assessments expressed are the opinions of the editorial staff based on public data as of the publication date and may change without notice. The value of investments can decrease as well as increase, and past performance is not indicative of future returns. Before any investment decision, it is advisable to consult a licensed financial advisor and evaluate the consistency of the operation with one's objectives, time horizon, and risk tolerance.