


On July 30, 2026, the dollar-yen exchange rate moved by 2.68% in a single session. No factory had closed, no company had published earnings: an expectation of what two central banks would do had changed. It's a good starting point to understand a mechanism that seems abstract but actually determines the cost of a mortgage, the value of a bond in a portfolio, and the price of what we import.
This guide follows the chain from start to finish, one link at a time: thirteen steps that begin with what a central bank is and lead to why markets move even before a decision is made. Difficult passages are not skipped, they are explained. And the last part is dedicated to cases where the chain breaks: this is what distinguishes those who understand the mechanism from those who have learned a slogan.
1. What is a central bank
A central bank is the institution that issues a currency for an area and governs its cost. It is not the bank where a citizen opens an account: it is the bank of banks. Credit institutions hold their deposits there and finance themselves from it, which gives the central bank leverage over the entire system.
Its main task is to maintain the stable purchasing power of money, meaning keeping inflation low and predictable. The European Central Bank's objective is 2% inflation in the medium term, and that is its primary mandate. The U.S. Federal Reserve has a dual mandate: price stability and maximum employment. This is not a formal detail: when the two objectives pull in opposite directions — rising prices and weakening employment — the Fed must balance them, while the BCE in principle does not. On the functioning of the two institutions, their instruments, and the question of their independence, Hub Finanza has a dedicated guide: BCE and Fed: how central banks work and why they move everything.
2. The official rate: the wholesale price of money
The main instrument is the official rate: the rate at which commercial banks finance themselves with the central bank or deposit excess liquidity there. It can be thought of as the wholesale price of money. All other rates in the economy — mortgages, business loans, short-term security yields — are formed starting from that level, adding compensation for risk and duration.
Names change from one institution to another. The Federal Reserve sets a target range for the fed funds, in August 2026 between 3.50% and 3.75%. The BCE uses the deposit facility rate as a reference, at 2.25%. The Bank of Japan governs the overnight rate, raised to 1.0% in June 2026: the highest level since 1995.
3. Expansionary or restrictive: two directions, one lever
Monetary policy is called restrictive when the rate is high enough to curb the economy, and expansionary when it is low enough to stimulate it.
A central bank raises rates when the demand for goods and services grows faster than the system's capacity to meet it, and prices rise. By making money more expensive, it discourages debt-funded purchases and investments, cools demand, and eases price pressure. It lowers rates in the opposite situation: when the economy slows, unemployment rises, and inflation falls below target. Cheap money makes borrowing to buy or invest convenient, and demand restarts.
Pay attention to a point that causes confusion: the threshold above which a rate is «high» is not fixed. Today's U.S. 3.5% is restrictive because inflation is running just above that level; the same 3.5% with 10% inflation would be strongly expansionary. What matters is the real rate, i.e., the rate net of expected inflation. On how inflation is measured and what it means for a saver, see Inflation: what it is, how it is measured, and how to protect your savings.
4. How a rate decided in a meeting room reaches the mortgage payment
The transition from decision to the real economy occurs through credit, and it is longer than one might think.
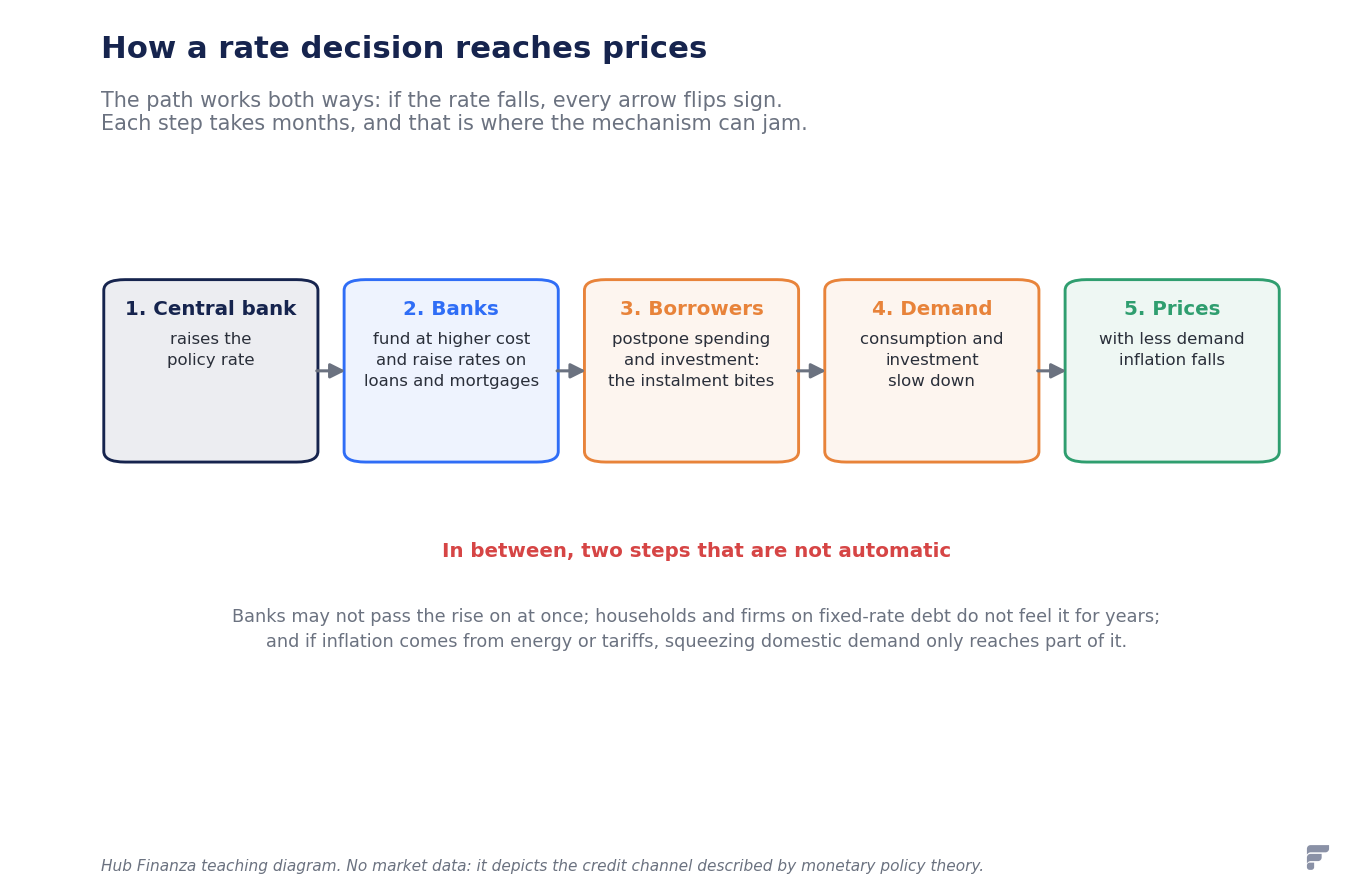
When the central bank raises the official rate, commercial banks finance themselves at a higher cost and pass the increase on to the rates they apply to mortgages and loans. A family considering buying a home finds a heavier payment and postpones; a company considering a new warehouse calculates that the project must yield more to repay the debt, and gives up on less profitable projects. Consumption and investments slow down, overall demand cools, and, over time, price pressure eases.
The same chain works in reverse when rates fall. In both cases, the time required is measured in quarters, not days: the most widespread estimates place the full effect on inflation between twelve and eighteen months. This is why central banks must decide by looking at where the economy will be, not where it is.
5. Where the mechanism breaks down
The credit channel has at least three weaknesses, and knowing them avoids wrong forecasts.
The first is bank transmission: banks do not transfer the increase immediately or uniformly. Those with plenty of liquidity can afford to wait.
The second is the composition of debts. Someone with a fixed-rate mortgage does not feel the increase until they renegotiate: in a country where fixed rates prevail, the tightening takes much longer to bite. In Italy, where the two formulas coexist, the effect is intermediate.
The third, and most important in the recent period, concerns the origin of inflation. If prices rise because energy costs more, or because a tariff has increased the cost of imports, compressing domestic demand only acts on part of the problem. The central bank can raise rates as much as it wants: it will not bring down the price of gas. On this interplay between raw materials, exchange rates, and prices, see Oil and dollar: why two prices move the entire market.
6. Bonds: why prices fall if rates rise
Here the chain enters the financial markets, and it's best to start with the simplest instrument.
A bond is a loan: whoever buys it gives money to the issuer, receives periodic interest (the coupon), and at maturity gets the principal back. The coupon is fixed at the time of issue and does not change.
Imagine a bond that repays 100 in ten years and pays 3% annually. If the market is willing to accept exactly 3%, that bond is worth 100. But if rates rise and new bonds offer 6%, no one will pay 100 for a bond that yields 3. The only way to make the old bond competitive is to pay less for it: by buying it at a lower price, the buyer earns the difference between the purchase price and repayment, and the overall yield comes back in line with the market.
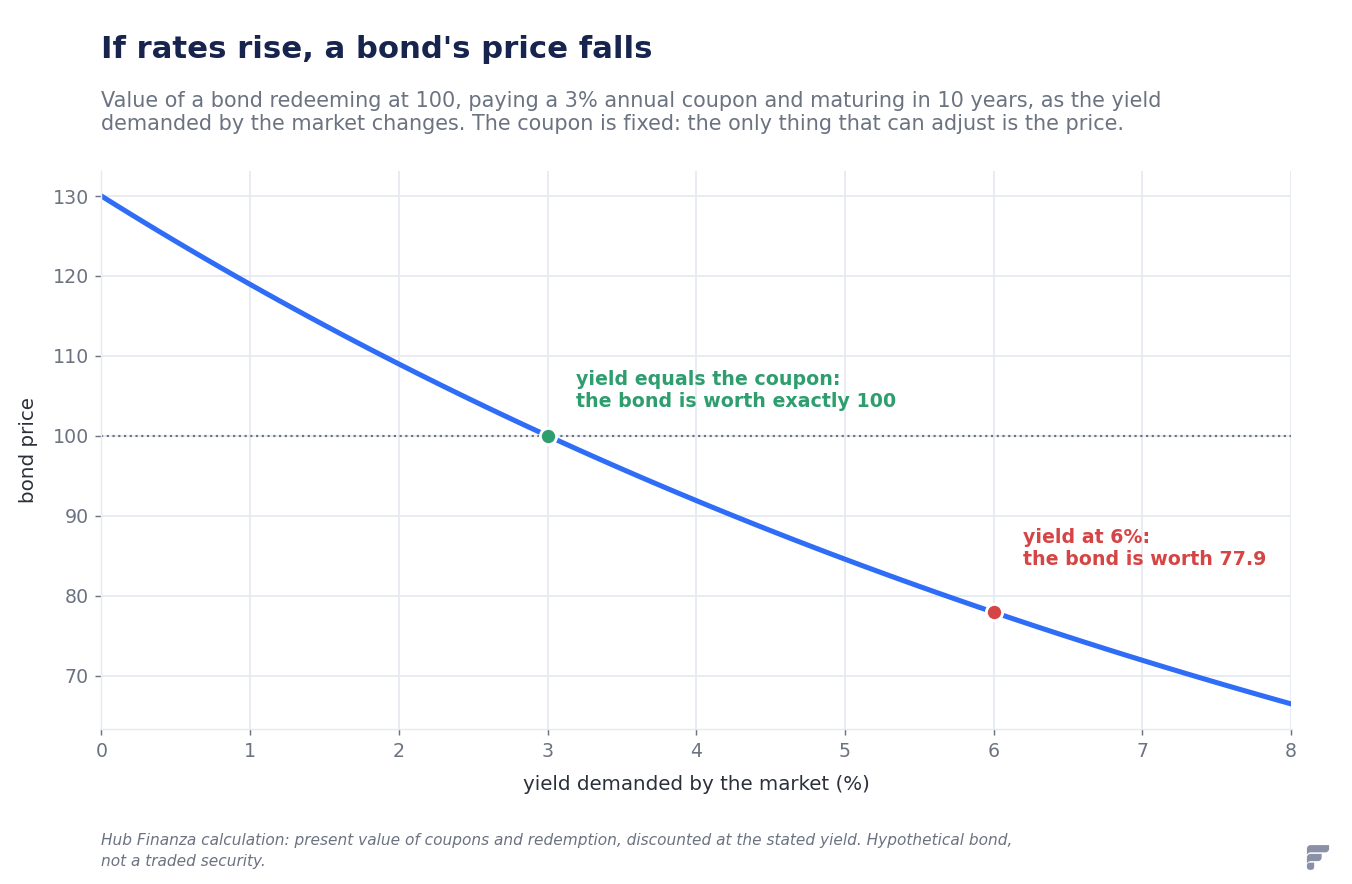
In the example, with a required yield of 6%, the bond is worth 77.9 instead of 100. This is the fundamental rule of the bond market: price and yield move in opposite directions. And it explains why in 2022, when central banks rapidly raised rates, those who held "safe" bonds in their portfolios recorded losses: the bonds were solid, but their price had adjusted to a world with higher rates.
7. The official rate and market yield are not the same thing
This is the distinction that is most often missed, and without it, the rest cannot be understood.
The official rate is a number decided by a committee at a given meeting, and it concerns the very short term. The market yield of a two-, ten-, or thirty-year bond is decided by no one: it emerges from trading, and reflects the average of the rates that operators expect over the entire life of that bond, plus compensation for uncertainty.
From this comes an important consequence: the two numbers can move in opposite directions. A central bank can leave the rate unchanged while ten-year yields rise, if the market fears more future inflation or more debt issuance. This happened in Japan in 2026: the official rate is at 1.0%, but the ten-year bond yield touched 2.878% in August, the highest level since 1996.
8. Why markets move before the meeting
If the yield reflects expected rates, then it moves as soon as expectations change — much earlier than the decision is made.
Operators continuously assign a probability to each scenario, and this can be read in the prices of interest rate futures contracts. In August 2026, for example, the probability of a Fed rate hike at the September meeting fell from 52% to 31% over the course of a week, after three weaker-than-expected U.S. data points. The Federal Reserve had done nothing: the forecast had changed, and two-year yields moved with it.
This leads to a phenomenon that surprises those observing markets for the first time: when the decision actually arrives, often the price does not move, or moves in the opposite direction. If a hike was expected by everyone, it is already incorporated into prices; what moves the market is the difference between what happens and what was expected. The same logic applies to listed companies' earnings: an excellent quarterly report can cause the stock to fall if the market expected more — the mechanism is explained in What moves stock markets: a guide to truly understanding equity markets.
9. Three central banks, three different stories
Before moving on to currencies, we need a snapshot of how deeply monetary policies can diverge.
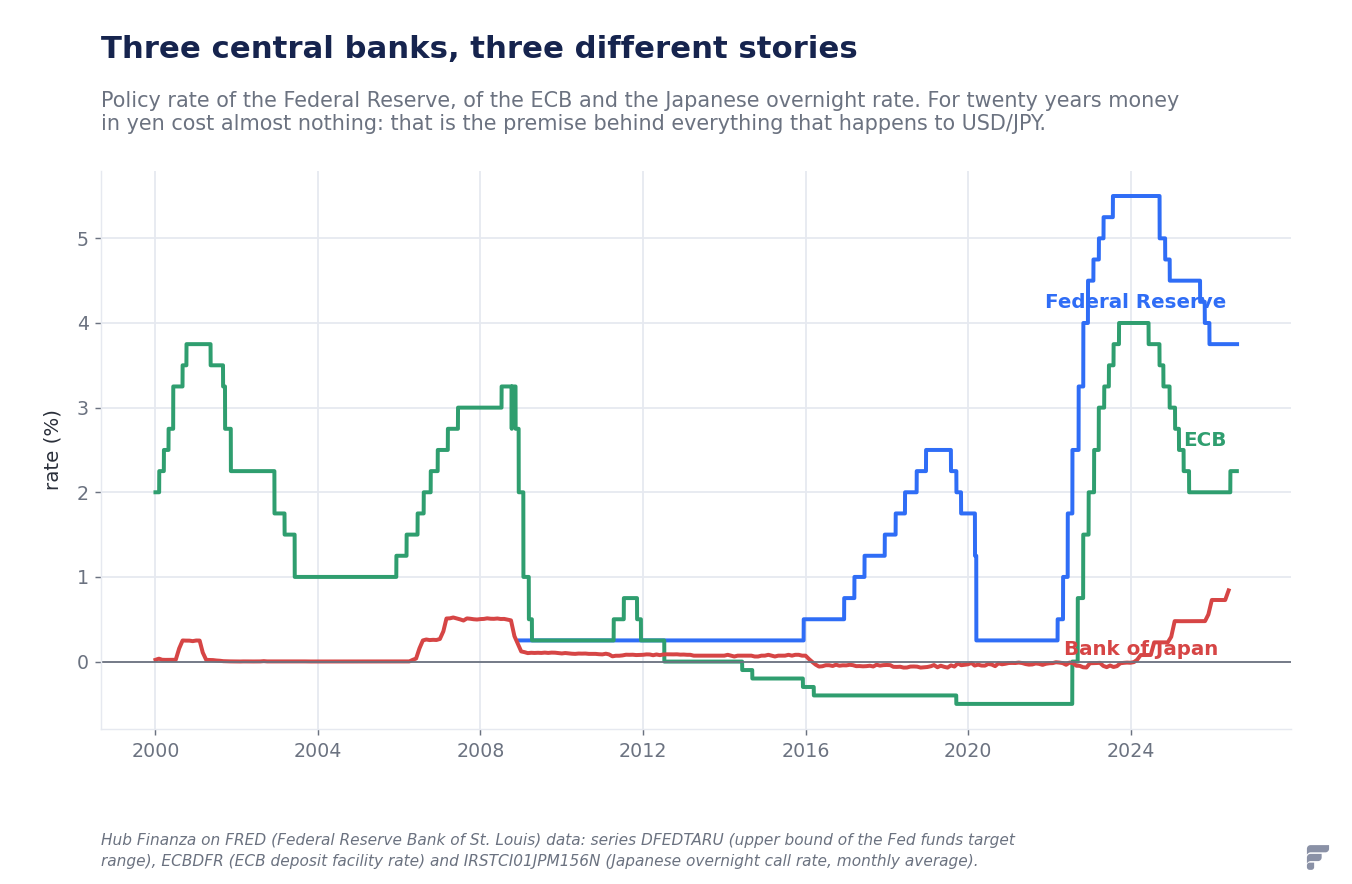
The chart shows twenty years in which the Federal Reserve and BCE raised and lowered rates following economic cycles, while Japan remained practically at zero — and at times below zero — in an attempt to exit a long phase of stagnant prices. This divergence is not a historical detail: it is the premise for everything concerning the yen. For twenty years, money in yen cost almost nothing, while in dollars it cost much more.
10. From yield differential to exchange rate
An exchange rate is the price of one currency expressed in another. Like any price, it is formed by the interaction of buyers and sellers — and one of the main reasons to buy a currency is that assets denominated in that currency yield returns.
The decisive point is that it's not the absolute yield that matters, but the difference between the two. An investor choosing between American and Japanese securities compares two remunerations: what attracts them is the gap, the yield differential. In August 2026, the American ten-year bond yielded 4.68% and the Japanese one 2.878%: a gap of approximately 1.80 percentage points in favor of the dollar.
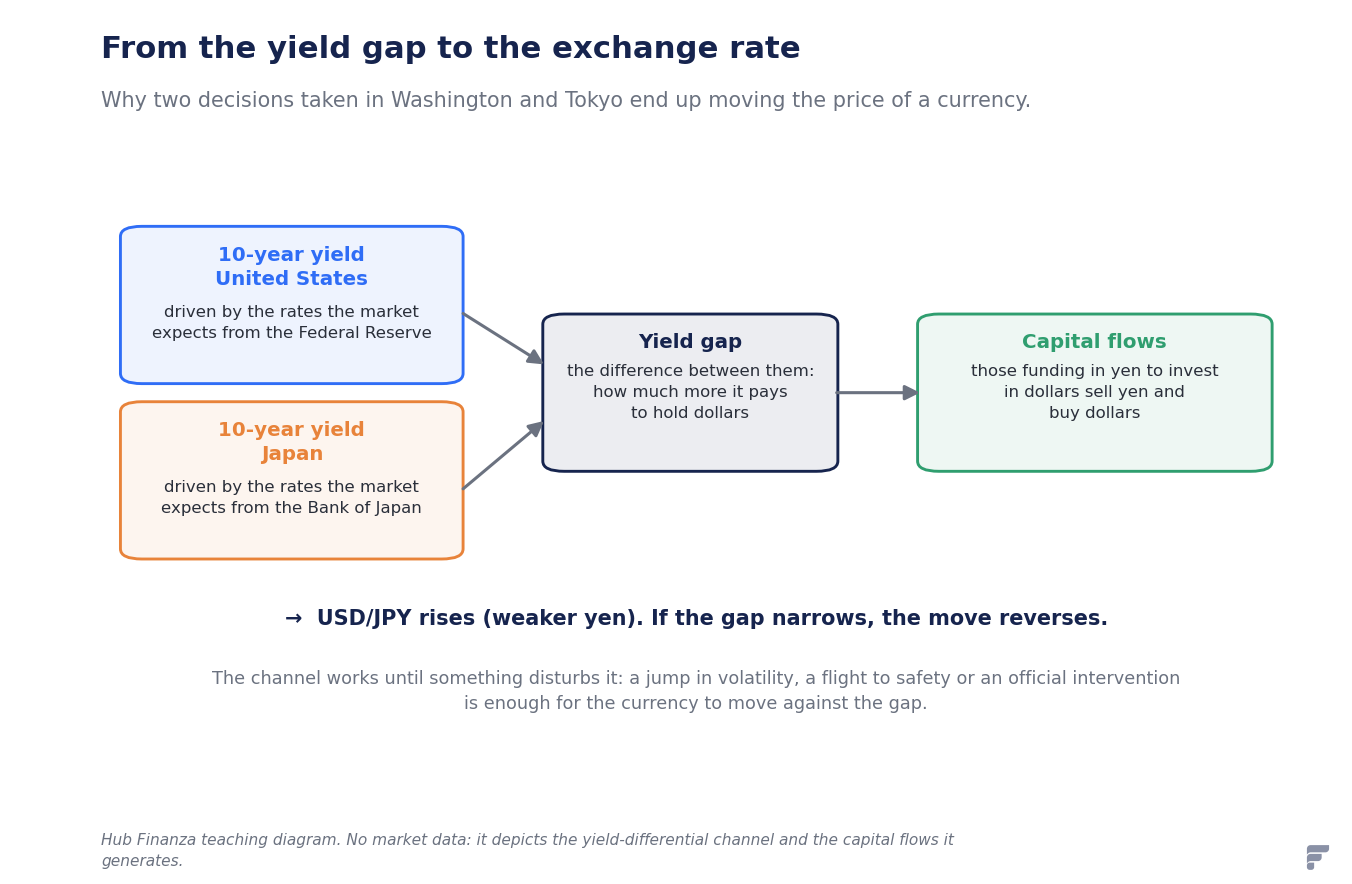
If the differential widens, holding dollars becomes relatively more convenient: capital moves, those buying dollar-denominated assets must first buy dollars by selling yen, and the dollar appreciates. If the differential narrows, the movement reverses. This is why expectations of higher U.S. rates tend to support the dollar, and expectations of lower rates tend to weaken it.
It's worth clarifying why an investor would actually benefit from moving. Anyone buying a foreign security considers three things: the return they earn, the risk that the issuer won't pay or that the price will fall, and the exchange rate risk, i.e., the possibility that the currency will depreciate, eroding the gain. A wide differential compensates for the first two; the third remains, and is why these movements can quickly reverse.
11. Carry trade: profiting from the difference between two rates
A specific operation, the carry trade, is built on the differential. In its simplest form: one borrows money in the currency that costs little — for twenty years, the yen — and invests it where it yields more. If one finances at 1% and invests at 4.7%, the difference is the gross profit.
Why this operation matters even for those who don't practice it: to carry it out, one must sell yen and buy dollars. When millions of similar operations accumulate over the years, the selling pressure on the yen becomes structural — and the exchange rate moves much more than the differential alone would explain.
However, the carry trade has a characteristic that makes it dangerous: it is asymmetric. Those who practice it earn little by little and regularly, but are exposed to a rapid loss if the financing currency strengthens. As long as the yen weakens slowly, positions remain open and fuel the movement. When something frightens the market — unexpected data, a jump in volatility, intervention by authorities on the exchange rate — many close together, and to close, they must repurchase yen. This is why the yen tends to weaken slowly and strengthen suddenly. It happened at the end of July 2026: the United States and Japan bought yen on the market for the first time since 1998, and in three sessions the exchange rate moved by over seven yen. The reconstruction is in United States and Japan buy yen for the first time since 1998.
12. Why "rates up, currency up" is not a law
We arrive at the part that is worth more than all the preceding ones. The chain described so far is a real mechanism, not a mechanical rule. One can verify how much it holds by measuring it.
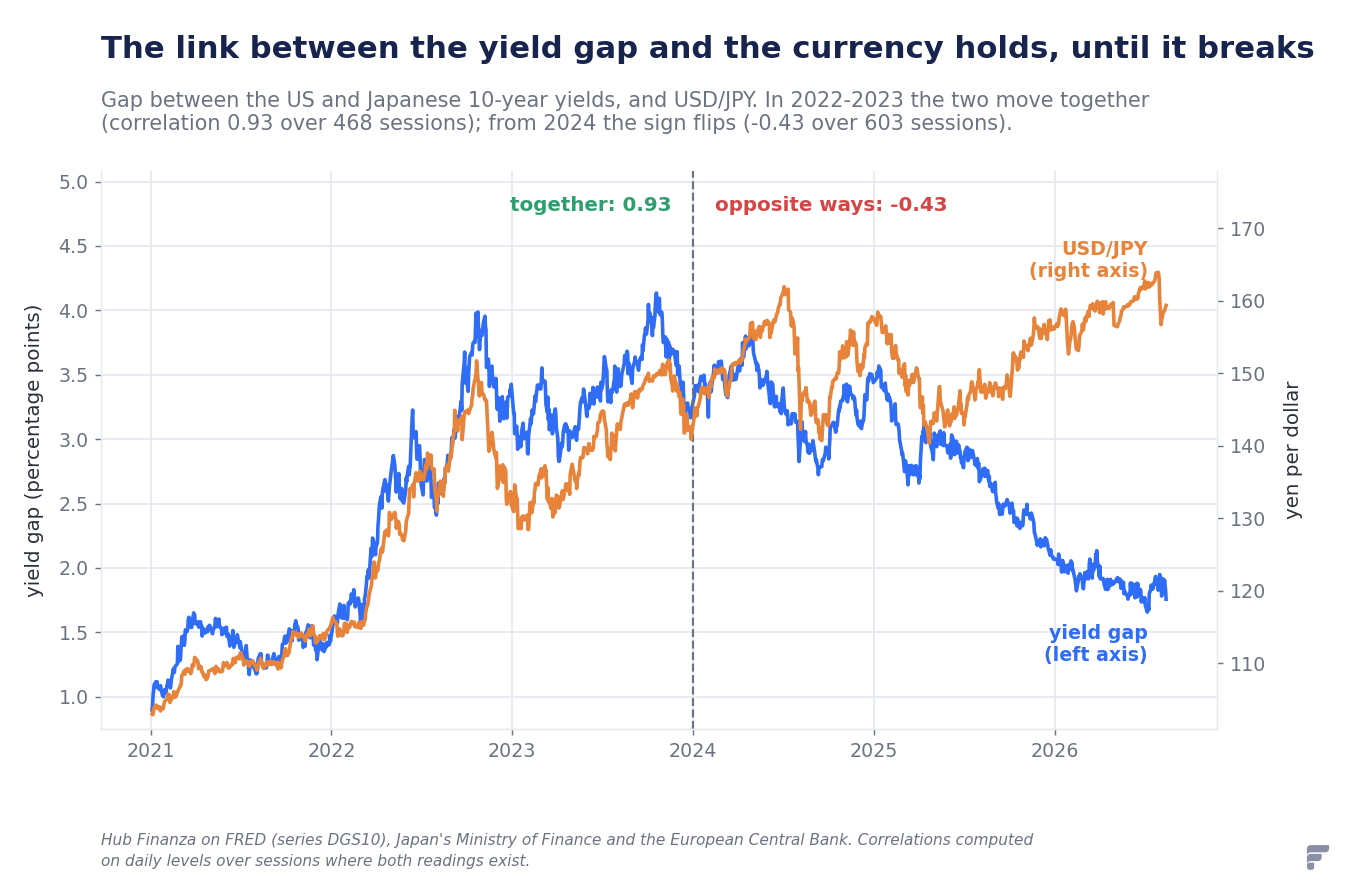
Comparing the differential between the U.S. and Japanese ten-year bonds and the dollar/yen exchange rate, in the 468 sessions of 2022-2023 the correlation between the two is +0.93: an almost perfect link, which in those years made the rule seem like a law of nature. In the 603 sessions from 2024 to August 2026, the same correlation is −0.43: the sign has reversed. The differential narrowed, yet the yen continued to weaken until it touched, on July 28, 2026, the lowest point in the BCE's entire historical series.
The explanations proposed by analysts are diverse and none are proven: the accumulated positioning by operators after years of carry trade, structural flows of Japanese savings abroad, the doubt that the Bank of Japan's normalization is proceeding too slowly. What is certain is the fact: the relationship has changed sign. Anyone who in 2024 had applied the rule learned in 2022 would have been wrong for two years.
Other factors that can prevail over the differential are known, and it is useful to keep them in mind:
- Inflation: what matters to an investor is the real yield. A country that raises rates while prices are rising more can still see its currency weaken.
- Growth: high rates in a recessionary economy attract less than lower rates in a solid economy.
- Risk: in periods of fear, capital seeks safety and liquidity, and moves towards the dollar, Swiss franc, and yen regardless of rates. This is the shift from risk-on to risk-off.
- Geopolitics and trade policy: tariffs, sanctions, and conflicts shift trade flows and thus currency demand.
- Positioning: when almost all operators are on the same side, it takes little to reverse the price, regardless of fundamentals.
- Official interventions: a finance ministry can buy or sell its own currency on the market. The effect is often temporary, but in the immediate term, it can override any differential.
A final caveat, which applies to the entire text: «the currency strengthens» makes no sense in absolute terms. A currency always moves relative to another. In 2026, the yen weakened significantly against the dollar and almost not at all against the euro, because the BCE rate, at 2.25%, is much closer to the Japanese 1.0% than to the American 3.50-3.75%. Changing the term of comparison changes the conclusion.
13. What to watch to follow the mechanism
Anyone wishing to observe this chain in action needs a few, always the same, indicators.
For rate expectations: the yield of the two-year government bond of the country of interest, which is the maturity most sensitive to monetary policy decisions, and the probabilities implied in official interest rate futures contracts. For the direction of monetary policy: meeting communiqués and minutes, and economic projections that some central banks publish periodically. For the exchange rate: the differential between the ten-year yields of the two countries. For data that moves expectations: inflation, employment, and consumption, whose meaning is explained in GDP and the labor market: how the health of an economy is (really) measured.
And a principle of method, more useful than any indicator: before assuming that a rate hike will strengthen a currency, it is worth asking whether that hike is already expected by the market. If it is, it's already in the price. What moves markets is not what happens, but the distance between what happens and what was imagined.
Sources
Inflation target and mandate of the European Central Bank from the BCE's monetary policy strategy; Federal Reserve's dual mandate from the Federal Reserve Act and from the Federal Open Market Committee's statements on long-run goals. Official interest rate levels in August 2026 — fed funds target range at 3.50-3.75%, BCE deposit facility rate at 2.25%, Japanese overnight rate at 1.0% from June 2026 — from the Federal Reserve Bank of St. Louis FRED series (DFEDTARU, ECBDFR, IRSTCI01JPM156N) and from the respective institutions' statements. Japanese 10-year government bond yield at 2.878% on August 14, 2026, highest since November 12, 1996, from the Japanese Ministry of Finance reference rates, historical series from 1974. U.S. 10-year yield at 4.68% from the daily U.S. Treasury yield curve. 2.68% change in dollar/yen exchange rate on July 30, 2026, from FRED's DEXJPUS series; daily dollar/yen exchange rate and euro/dollar and euro/yen levels from European Central Bank reference rates. Implied probabilities of a Federal Reserve hike in September 2026 (from 52% to 31% in one week, CME FedWatch data) from Reuters, August 17, 2026. Joint intervention by the United States and Japan on July 30-31, 2026, from CNBC and Al Jazeera. Correlations between yield differential and exchange rate (+0.93 over 468 sessions in 2022-2023; −0.43 over 603 sessions from 2024 to August 13, 2026) are calculated by the editorial staff on daily levels of the cited series, limited to sessions where both readings exist. The twelve-to-eighteen-month lag in monetary policy transmission is the recurring estimate in central bank literature and should be understood as an order of magnitude, not a precise measurement. The bond price example is an editorial calculation on a hypothetical bond, not on a real quoted security.
This article is for informational purposes only and does not constitute financial advice, investment research, a public offering of securities, or a personalized recommendation to buy or sell. The assessments expressed are the opinions of the editorial staff based on public data as of the publication date and may change without notice. The value of investments can decrease as well as increase, and past performance is not indicative of future returns. Before making any investment decision, it is advisable to consult a qualified financial advisor and evaluate the consistency of the operation with one's objectives, time horizon, and risk tolerance.