
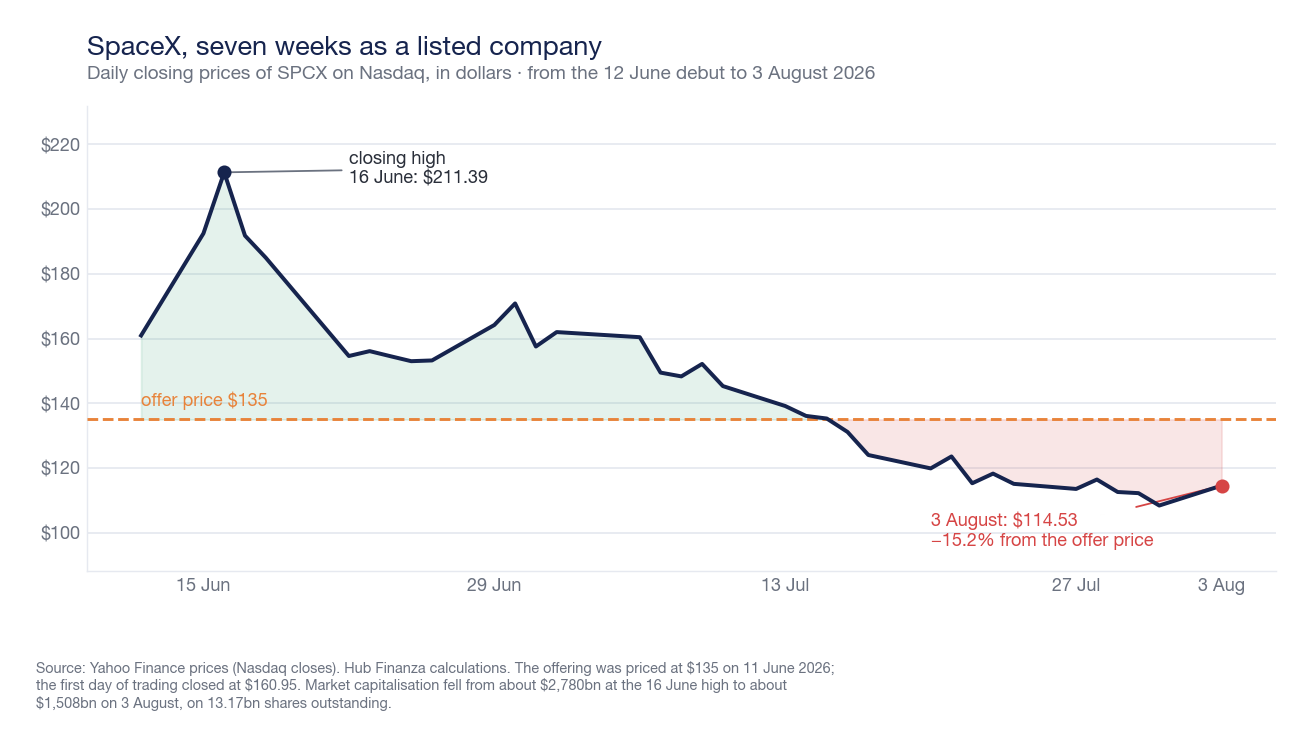
On Tuesday, August 4, 2026, after US markets close, SpaceX will publish its first quarterly report as a listed company. Seven weeks have passed since its Nasdaq debut on June 12, the largest initial public offering ever, and the market has already shifted from euphoria to reconsideration: on Monday, August 3, the SPCX stock closed at 114.53 dollars, 15.2% below the offering price of 135 dollars and 45.8% below the closing high touched on June 16. In absolute terms, this means approximately 1.27 trillion dollars in market capitalization evaporated in thirty-five sessions.
Two days after the earnings report, on Thursday, August 6, the first lock-up expiration for restricted shares takes effect: 911.5 million shares held by employees and long-term shareholders become tradable. It is the combination of these two events — the first examination of the numbers and the first wave of potential supply — that makes this week the true baptism of the stock. And it offers a test case for the entire pipeline of mega listings to follow: Anthropic and OpenAI both filed their prospectuses confidentially in June.
Seven weeks: from record to reconsideration
The offering was priced on June 11 at 135 dollars per share: 555.6 million shares for 75 billion dollars raised, rising to 85.7 billion on June 15 when the underwriters exercised their overallotment option on an additional 83.3 million shares. At the offering price, the company was valued at 1.77 trillion dollars. To provide a historical comparison: the previous record belonged to Saudi Aramco, which in December 2019 had raised 25.6 billion dollars, 29.4 with the overallotment.
The operation was also structured unusually in terms of distribution: about 30% of the shares were reserved for individual investors through Charles Schwab, Fidelity, Robinhood, SoFi, and E*Trade, compared to retail allocations that typically remain single-digit in large IPOs. Total demand collected in the order book exceeded 250 billion dollars, with over 100 billion from the retail channel alone. The first day of trading closed at 160.95 dollars, 19.2% above the offering; on June 16, the stock marked an intraday high of 225.64 dollars and a closing high of 211.39, with a market capitalization close to 2.78 trillion.
From there, the descent was almost uninterrupted. In mid-July, the stock slipped below the offering price, and on July 31, it closed at 108.37 dollars, the period's low, before a 5.7% rebound on Monday, August 3, on the eve of the earnings report.
What the market expects from the earnings
Analysts' consensus places second-quarter revenues between 6.82 and 6.9 billion dollars — 6.9 according to Visible Alpha's compilation — compared to 4.69 billion in the first quarter of 2026. Profitability estimates are much more uncertain: the expected loss per share is around 26 cents, but individual forecasts range from a loss of 1.26 dollars to a profit of 33 cents. A dispersion of that magnitude, for the first quarter of coverage, primarily indicates that analysts do not yet have a shared model for this company.
The starting point is the 2025 financial statement filed with the S-1 form to the SEC on May 20, 2026: 18.7 billion dollars in revenues, growing 33% over 2024, adjusted EBITDA of 6.6 billion, operating loss of 2.6 billion, and net loss of 4.9 billion. The first quarter of 2026 added 1.9 billion in operating loss and 4.28 billion in net loss.
The structure of the accounts explains why the stock is so sensitive to the quarterly report. Only one segment generates cash.
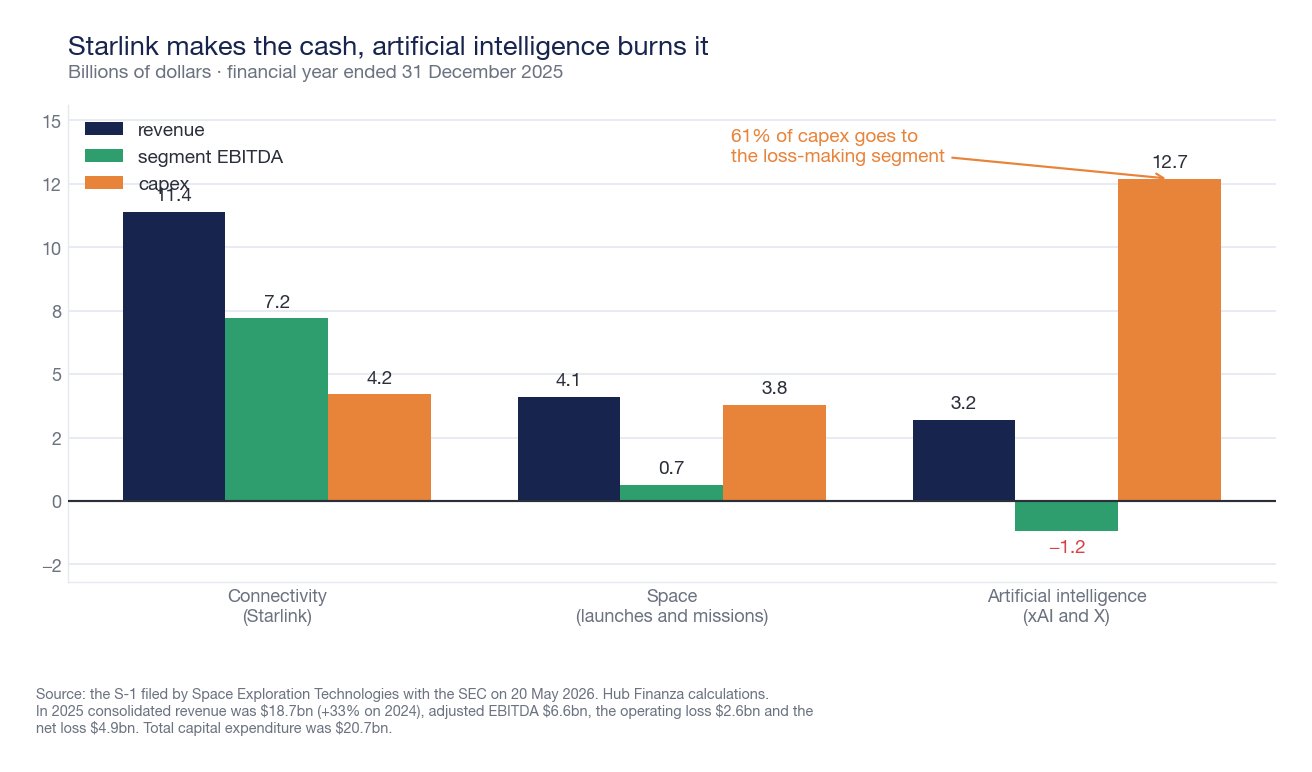
Starlink — the Connectivity segment — generated 11.4 billion in revenues in 2025 (+50%) with 7.2 billion in segment EBITDA. Launches, the original business, produced 4.1 billion in revenues (+8%) and 653 million in EBITDA over 170 missions, approximately 85% of global orbital launches. The artificial intelligence segment, born from the xAI incorporation finalized on February 2, 2026, with an all-stock merger that valued the combined entity at 1.25 trillion dollars, brought 3.2 billion in revenues and a negative EBITDA of 1.2 billion — absorbing, however, 12.7 of the 20.7 billion in investments for the fiscal year.
Three numbers within the quarterly report matter more than the others. The first is Starlink subscribers: 10.3 million as of March 31, 2026, in 164 countries, doubled in one year. The second is the average revenue per subscriber, which fell to 66 dollars per month in the first quarter of 2026 from 81 dollars in 2024: volume growth is coming at decreasing prices, and this is where it is measured whether the segment remains profitable as it expands. The third is cash: 15.9 billion as of March 31 compared to 24.7 billion at the end of 2025, against 29.1 billion in debt. This is also why the IPO was sized as it was.
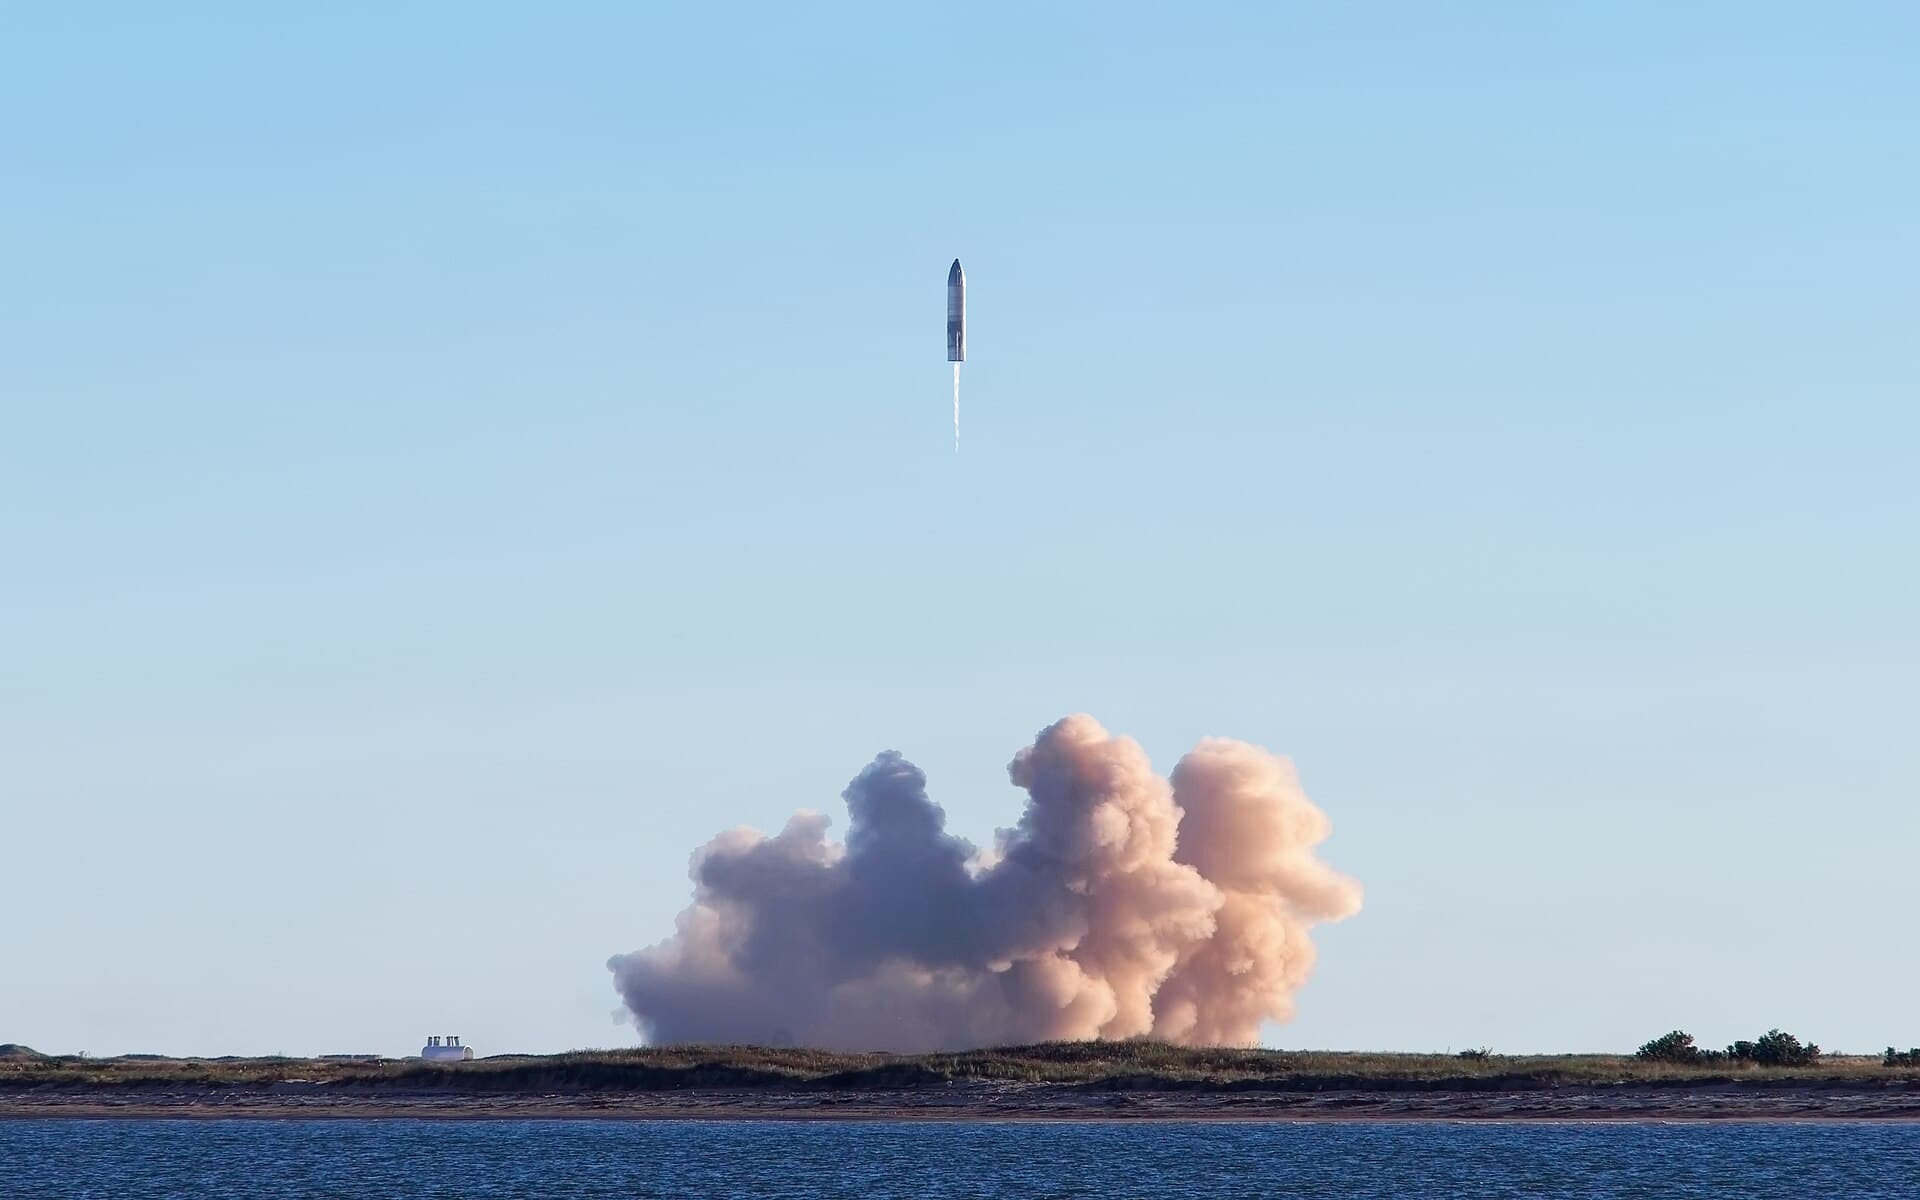
On the industrial front, the quarter has two favorable elements. On June 5, the agreement with Google Cloud was announced: 920 million dollars per month for approximately 110,000 graphics processors and related computing capacity, from October 2026 to June 2029, for a total value of around 30 billion. And on July 25, Starship successfully completed its thirteenth test flight, releasing twenty Starlink V3 satellites, although the final ignition for the booster's splashdown was only partially successful. The first guidance for the full year 2026 — the first official forecast the company has ever provided — will indicate how much of all this is already in the accounts.
Analysts, for now, remain broadly positive: Morgan Stanley confirms its overweight rating with a 300 dollar target, Goldman Sachs initiated coverage with a buy rating and a 205 dollar target. The consensus compiled by MarketBeat counts 23 buy ratings, six neutral, and one sell, with an average target of 239 dollars; the range of estimates, however, goes from 115 to 800 dollars.
The August 6 wall: when vested equity becomes tradable
Those who work at SpaceX have accumulated vested equity for years, which, as long as the company was private, could only be monetized through buyback windows organized by the company. The listing changes the nature of the problem: from Thursday, August 6, those shares can be sold on the market, and the unlock calendar is staggered.
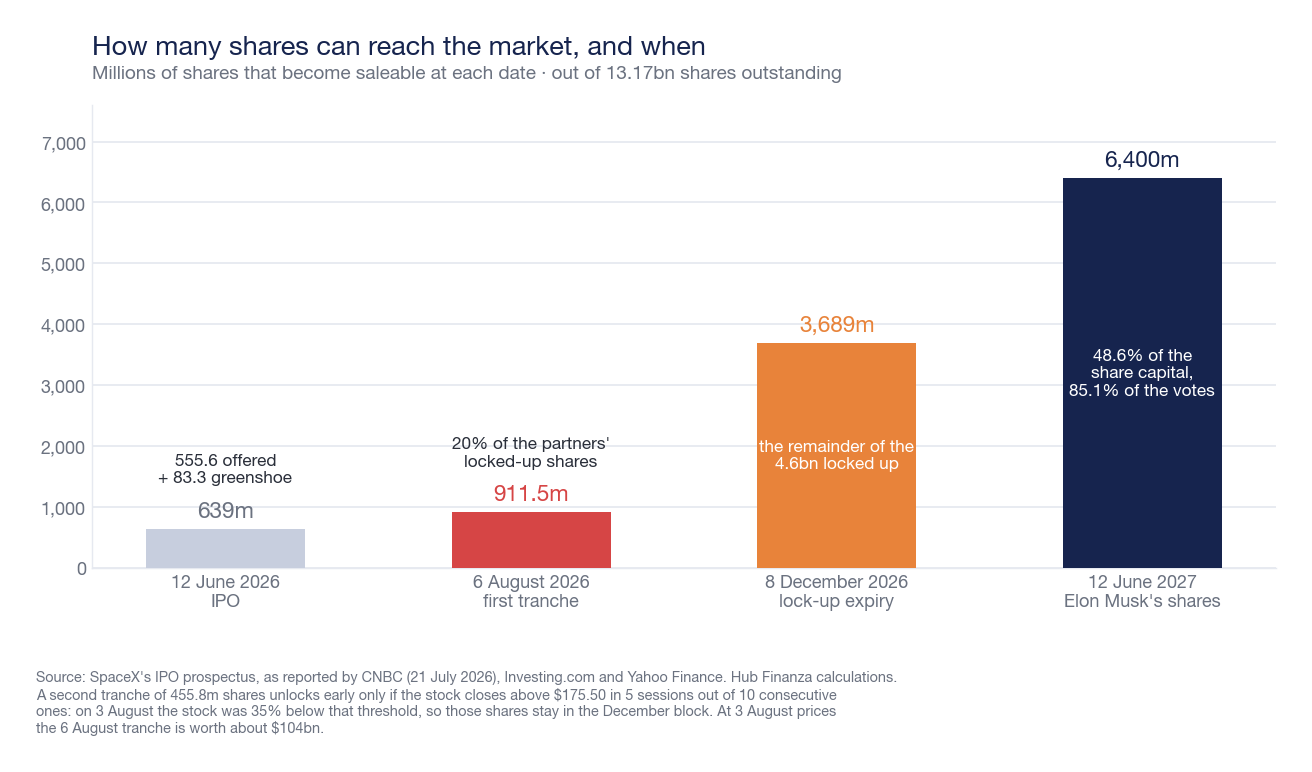
The first tranche concerns 20% of the approximately 4.6 billion restricted shares of non-founder shareholders: 911.5 million shares, which at August 3 prices are worth approximately 104 billion dollars. For comparison, this is one and a half times the entire June offering. The unlock is unconditional: it happens regardless of the price.
A second tranche of 455.8 million shares was conditional on the stock closing above 175.50 dollars in five out of ten consecutive sessions. With the stock at 114.53 dollars, 35% below that threshold, the condition was not met: those shares slide to December 8, 2026, when the full 180-day lock-up expires and up to 3,689 million remaining shares are freed. Elon Musk's 6.4 billion shares — 48.6% of capital but 85.1% of voting rights, thanks to the dual-class structure — remain restricted until June 12, 2027.
It must be stated precisely: an unlock is not a sale. It determines how many shares can come onto the market, not how many will. The data to watch in the sessions following August 6 is not the price but the volumes: these will tell us how much of that supply actually materialized.
Meta's lesson, which 2026 is mirroring
The most instructive precedent is fourteen years old. Facebook listed on May 18, 2012, at 38 dollars, closed the first session at 38.23 — a gain of 0.6%, practically nothing — and from there began to fall. On September 4, 2012, it closed at 17.73 dollars, less than half the offering price. In between, in August, the first lock-up on 271 million shares had expired. Exactly twelve months after its debut, the stock was worth 25.76 dollars, 32.2% below the offering price, and it took fourteen and a half months, until July 31, 2013, for it to return to the initial 38 dollars.
The aftermath is the part often forgotten when citing that disaster: at the close on August 3, 2026, Meta is worth 590.24 dollars, fifteen and a half times the offering price. The first year had said nothing about the decade.
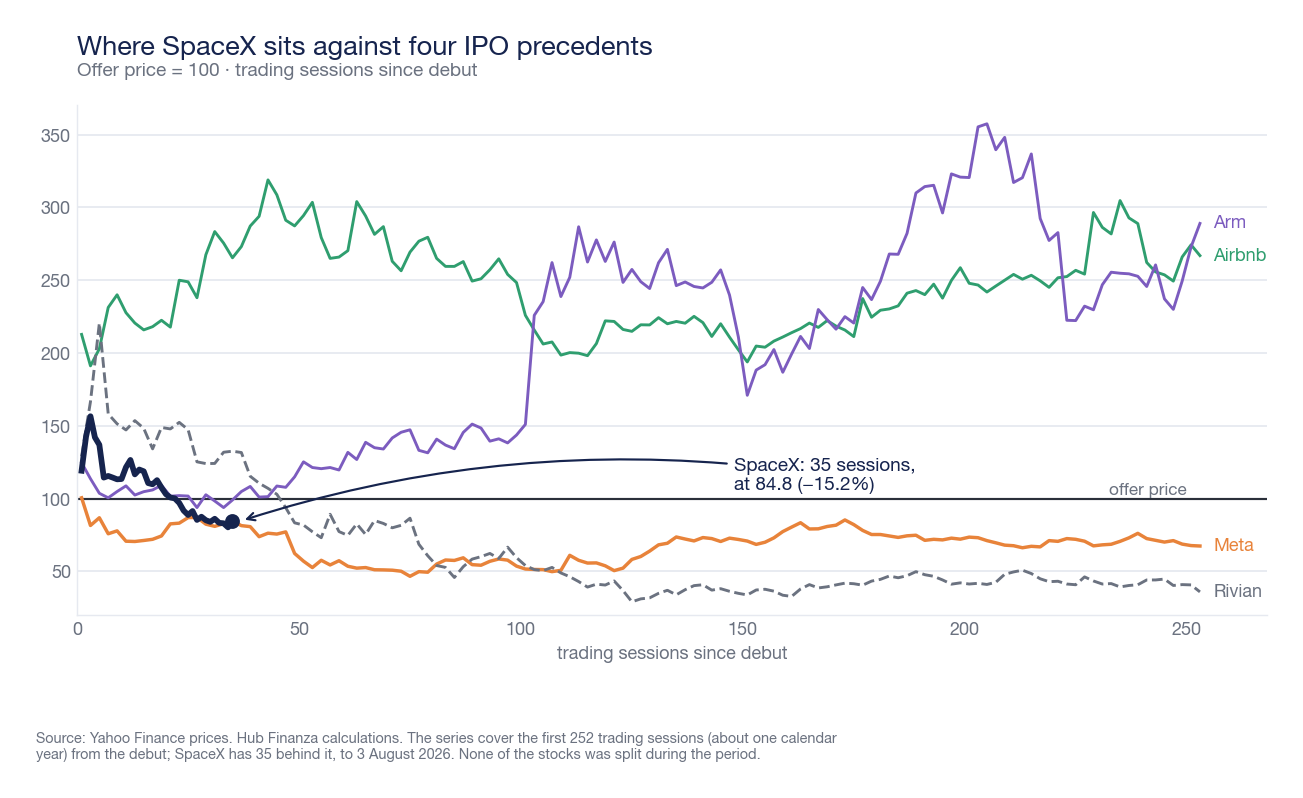
However, beware of the flip side, because it exists and is equally well-documented. Rivian listed in November 2021 at 78 dollars, reached more than double that in the first few sessions, closed its first year at -57.7%, and on August 3, 2026, was trading at 15.36 dollars: 80% below the offering, almost five years later. A negative first year is not a condemnation, but it is not a guarantee of redemption either. The difference, in both cases, was the company's ability to convert growth into cash.
Eleven major IPOs, one lesson
Broadening the view to eleven of the most significant listings in the last twenty years, the picture that emerges is less comforting than the IPO narrative suggests.
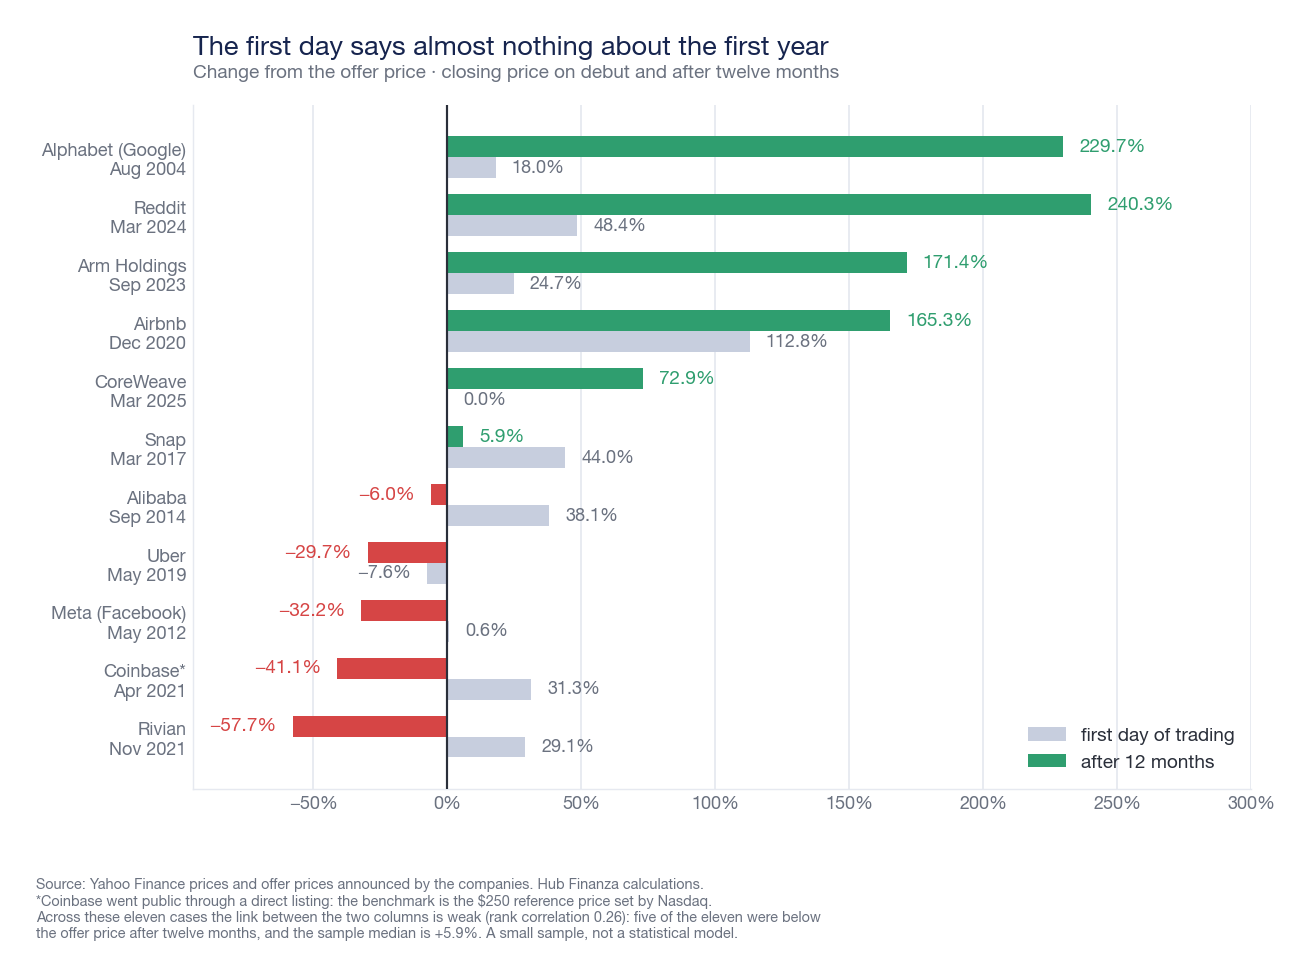
Five out of eleven stocks, after twelve months, were below the offering price; the sample median is a modest +5.9%, supported at the extremes by Reddit (+240.3%), Alphabet (+229.7%), and Arm (+171.4%). Crucially, the link between the first-day splash and the one-year return is weak: the rank correlation coefficient stands at 0.26. Snap gained 44% on its debut and was at +5.9% after twelve months; Alibaba gained +38.1% on the first day and closed the year at -6%; CoreWeave closed its debut exactly at the offering price and twelve months later was at +72.9%. Eleven cases are not a statistical model, but they are enough to dismantle the idea that the first day of trading is an indicator.
In comparison, SpaceX came to market with a peculiarity none of the eleven had: a net loss of 4.9 billion dollars in the last closed fiscal year and investments equal to more than its revenues. This structure makes the stock very sensitive to future expectations and little anchored to current results — the exact profile that, in phases of risk aversion, moves first and more than others.
The queue behind: Anthropic and OpenAI
The outcome of SpaceX's debut directly impacts the two operations expected to follow. Anthropic closed a 65 billion dollar capital raise on May 28, 2026, at a post-money valuation of 965 billion — the Series H round, led by Altimeter, Dragoneer, Greenoaks, and Sequoia among others — declaring annualized recurring revenues exceeding 47 billion. It filed its prospectus confidentially on June 1 and, according to CNBC, in mid-July the mandated banks (Goldman Sachs, Morgan Stanley, and JPMorgan) were organizing investor meetings for a listing as early as October.
OpenAI raised 122 billion dollars in March 2026 at a post-money valuation of 852 billion and also filed confidentially in June. CFO Sarah Friar had indicated in January 2026 that annualized revenues exceeded 20 billion; internal projections reported by the press indicate losses around 14 billion for 2026. Following the performance of SpaceX stock, according to various journalistic accounts, the company is reportedly considering postponing its listing until 2027. Neither date is confirmed by the companies: currently, these are confidential filings and rumors.
The connection is mechanical. SpaceX is the reference precedent on which underwriters calibrate the price and size of upcoming operations. If an offering with a 1.77 trillion dollar valuation, with 30% placed in retail hands, trades 15% below the issue price after seven weeks, the order book for the next mega IPO is built with different assumptions.
What to watch, in order
Tonight, in the press release and the conference call scheduled for 10:30 PM Italian time, five numbers will shift judgment: revenues compared to the 6.82-6.9 billion dollar range; Starlink subscribers and especially the average revenue per subscriber, which will tell if volume growth is eroding margins; the Connectivity segment's margin, the only one that must finance the losses of the other two; the investment plan after the 20.7 billion in 2025; and the first annual guidance, with an indication of how much of the Google contract is already accounted for.
Then, from Thursday, the second test: trading volumes after the unlock. And finally, December 8, when the residual lock-up expires. For a stock that capitalizes approximately 1.508 trillion dollars against 18.7 billion in revenues — eighty times the revenue of the last closed fiscal year — the sequence of the next four months matters more than any single quarterly report. The history of major listings suggests that the verdict will not arrive tonight or Thursday: it will arrive when it becomes clear whether Starlink can finance artificial intelligence before cash runs out.
Sources
Financial data and capital structure from the S-1 form filed by Space Exploration Technologies with the SEC on May 20, 2026. Details of the offering, overallotment exercise, and debut chronicle from CNBC, Forbes, and Reuters (June 11-16, 2026). Lock-up calendar and conditions from the listing prospectus, as reported by CNBC (July 21, 2026), Investing.com, and Yahoo Finance. Consensus estimates for the second quarter from Visible Alpha, Seeking Alpha, and S&P Global Market Intelligence; ratings and price targets from Benzinga, TipRanks, and MarketBeat. Agreement with Google Cloud from CNBC (June 5, 2026). Thirteenth Starship test flight from ANSA and Treccani (July 25, 2026). Anthropic's capital raise and confidential prospectus from Reuters, as reported by NBC News and TechCrunch (May 28, 2026), and from CNBC (July 15, 2026); OpenAI data from Reuters, Barchart, and public company statements. Quotes, offering prices, first-day closes, and twelve-month returns calculated at the close of August 3, 2026; none of the stocks used in comparisons underwent splits during the period considered, with the exception of Alphabet, for which unadjusted values from 2004 and 2005 were used. Calculations on capitalization, multiples, medians, and correlation are editorial elaborations based on cited data.
This article is for informational purposes only and does not constitute financial advice, investment research, a solicitation for public savings, or a personalized recommendation to buy or sell. The assessments expressed are editorial opinions based on public data as of the publication date and may change without notice. The value of investments can decrease as well as increase, and past performance is not indicative of future results. Before making any investment decision, it is advisable to consult a qualified financial advisor and evaluate the consistency of the operation with your objectives, time horizon, and risk tolerance.