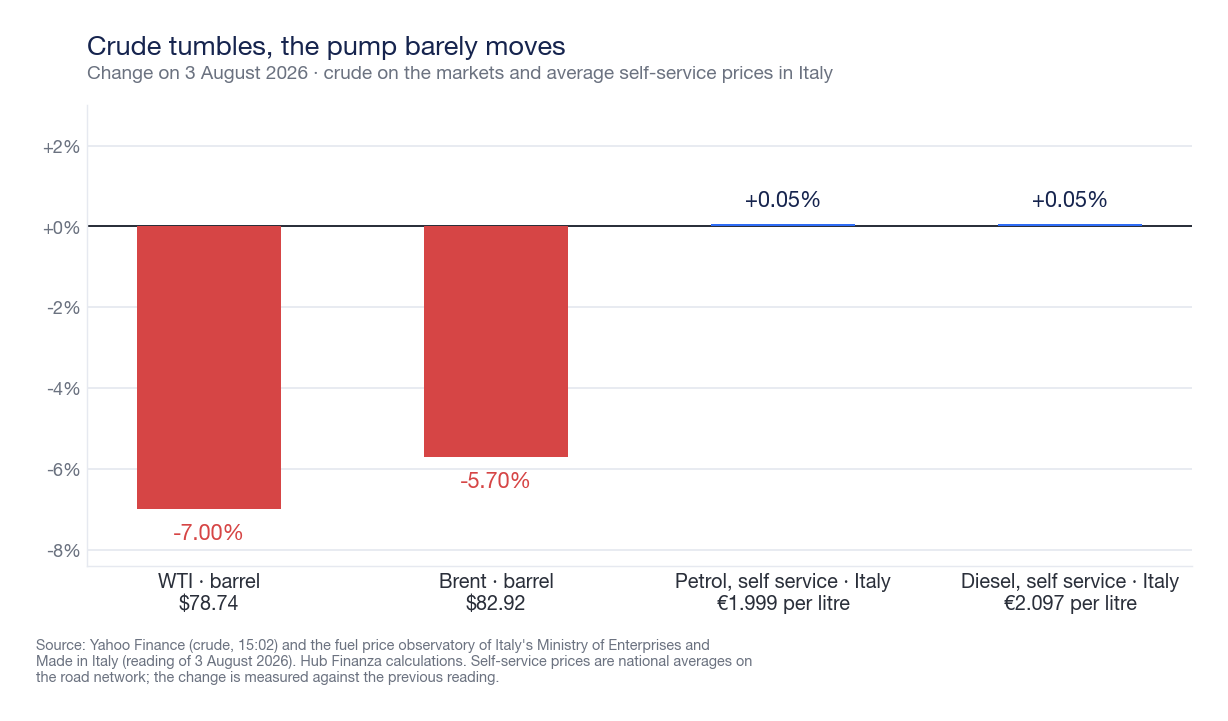
A sentence published overnight between Saturday and Sunday wiped out almost all the gains crude oil had built over three weeks. Donald Trump announced that he had stopped the attack against Iran that had already been prepared — «the largest since the last world war», in his words — and had reopened negotiations with Tehran. At 3:02 PM Italian time on Monday, August 3, 2026, American WTI crude (September contract) was trading at 78.74 dollars per barrel, down 7.00% compared to Friday's closing price of 84.67; October Brent was at 82.92 dollars, 5.70% less than the previous 87.93. During the morning, the lows were 78.62 and 81.85 dollars, respectively.
It is the most violent movement since the beginning of summer, and it has shifted everything else: European stock markets gained between 0.8% and 1.4%, Wall Street futures rose, and US Treasury yields fell. The market, in other words, has begun to price in a scenario where energy costs less and inflation is less frightening. With a caveat worth noting immediately: the Strait of Hormuz, the true core of this crisis, was still closed at 3 PM on Monday.
What Trump really said
The US president explained that he abandoned the military operation after a request from Tehran and pressure from Gulf allies — Qatar, Saudi Arabia, and the United Arab Emirates — because, he wrote, «the perimeters of an agreement have been agreed upon». The deal the White House is aiming for would have two pillars: the reopening of the Strait of Hormuz to commercial shipping and the end of Iran's nuclear program. «We are talking to them in the form of a negotiation: it starts tomorrow afternoon,» Trump stated on Sunday, referring to Monday, August 3.
The market reaction was based on this promise, not on a signed agreement. And this is where caution is needed: Tehran has not confirmed the same version. The spokesperson for the Iranian Ministry of Foreign Affairs, Esmaeil Baghaei, clarified on Monday that the technical agreement being finalized with Oman on a new maritime route is «a necessary but not sufficient condition» for the reopening of the strait, and he recalled that the closure does not depend on differences between Tehran and Muscat but on the ongoing conflict. Al Jazeera reported on August 2 that the Iranian-Omani talks are «in their final phase». Between a safe route agreed with a neighbor and the full reopening of a sea lane a few tens of kilometers wide, in short, there is still a political distance.

Why the same decline is read as «-6%» or «-9%»
On the same day, very different percentages were reported, not because anyone made a mistake in the calculations: it depends on which instrument is being looked at. This is a distinction worth clarifying, as it reappears every time oil moves significantly.
- Futures contracts. These are the reference for agencies: WTI September traded on NYMEX and Brent October on ICE. They are compared to the official closing price of their respective contracts. This is where the -7.00% for WTI and -5.70% for Brent come from. In the morning, CNBC reported WTI down almost 6% at 79.57 dollars and Brent at -4.88% at 83.64: legitimate snapshots of a market that continued to fall in the meantime.
- Crude oil CFDs, i.e., the «USOIL» and «UKOIL» charts seen on platforms and in the chart above. They track the spot price and are compared to that market's Friday level, which during periods of high supply tension is above the nearest expiry contract. Result: the same crash, measured on the CFD, is close to 9%. The case of Brent demonstrates this with verifiable numbers: TradingKey noted the UKOIL CFD at 82.84 dollars with a -7.69%, against the -4.88% of the October contract at the same time.
Neither reading is wrong; they are two different metrics. Those looking at the industrial cost for a refinery follow the future, while those looking at the spot price fluctuation follow the CFD. The substance, however it is measured, does not change: between 6 and 9 percentage points burned in a single session.
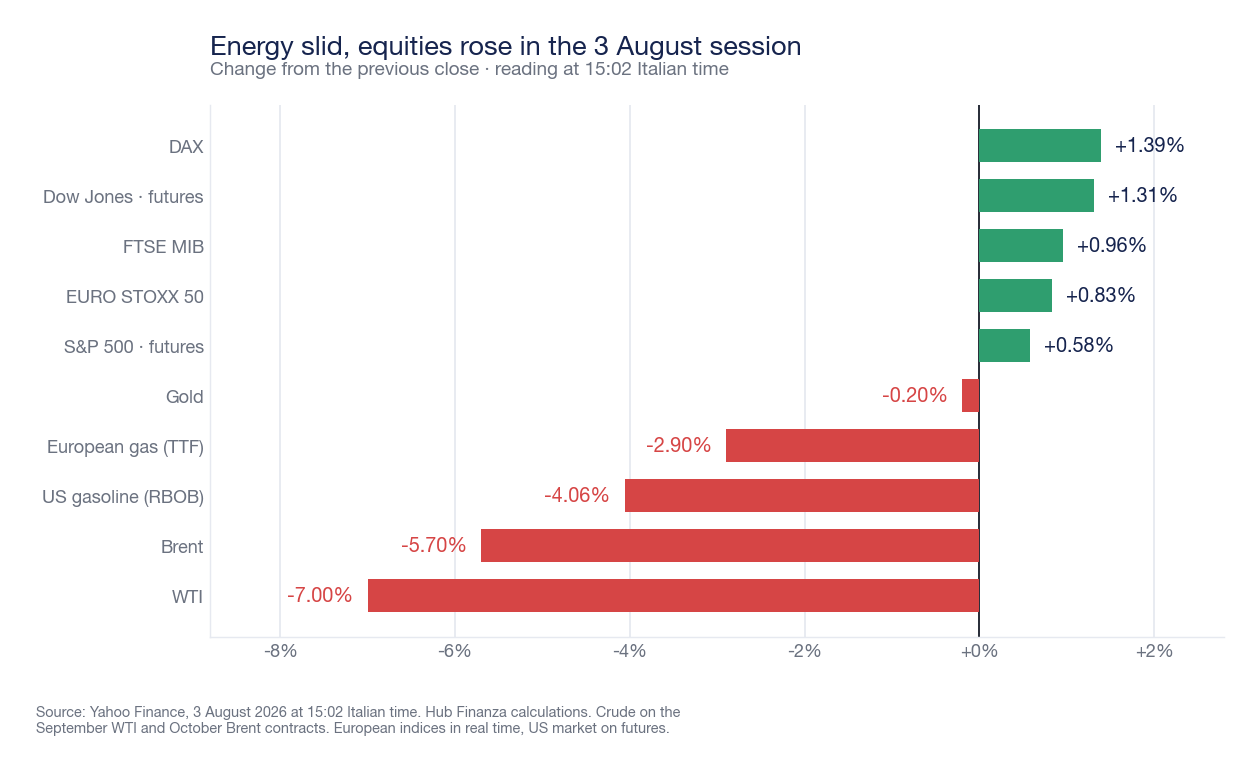
Energy decline becomes stock market gain
The transmission channel is classic and was observed entirely within a few hours. At the same 3:02 PM survey, the DAX gained 1.39%, the FTSE MIB 0.96% to 52,673 points, and the EURO STOXX 50 0.83%. On US futures, the Dow Jones rose 1.31% and the S&P 500 0.58%, while the Nasdaq lagged (+0.13%): a rally led by cyclical and consumer sectors, not technology, which is exactly the signature of a movement triggered by energy costs.
In the bond market, the yield on the 10-year Treasury fell from 4.74% to 4.68%: less expected inflation means less expected rates. Gold, which had served as a refuge during weeks of escalation, ceded 0.20% to 4,099 dollars per ounce, and the VIX volatility index remained just below 16. The energy decline, furthermore, did not only concern crude oil: wholesale gasoline in the United States (RBOB contract) lost 4.06% and European TTF gas 2.90%.
Wall Street opening confirms the rotation
Confirmation arrived at 3:30 PM Italian time, with the start of trading in New York. Thirteen minutes after the opening bell, the Dow Jones gained 1.10% to 53,062 points, the Nasdaq Composite 0.74% to 25,561, and the S&P 500 0.60% to 7,535. The morning's futures not only held up, but the index most tied to the traditional economy, the Dow, performed better than the technology-focused Nasdaq — the exact opposite of the configuration that dominated in recent weeks.
The sectoral detail explains why. Fuel is the second-largest cost item for an airline after personnel, and the market priced this in immediately: American Airlines +6.19%, United +5.56%, Delta +4.22%, Southwest +3.62%. In the opposite direction were crude oil producers, whose margins depend on expensive barrels: Occidental -3.13%, ConocoPhillips -2.29%, Chevron -1.34%, ExxonMobil -1.14%, with the energy sector index down 1.78%. The discretionary consumer sector, which gains purchasing power from cheaper fuel, rose 2.62%.
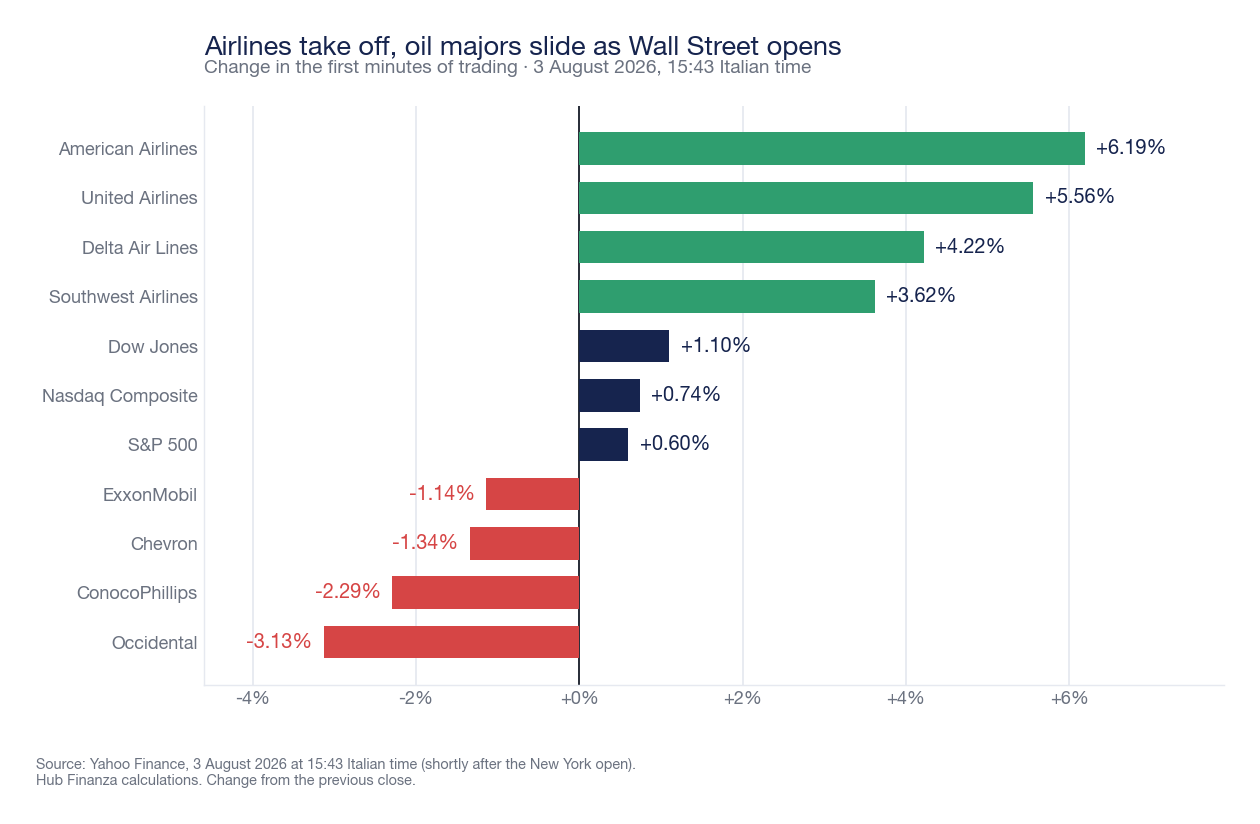
It is a textbook rotation, and it should be read for what it is: not a generalized rally, but a transfer of value from those who sell energy to those who consume it. The rest of the picture remained consistent with this interpretation. At 3:43 PM, the dollar ceded 0.19% against the basket of major currencies, gold fell to 4,087 dollars per ounce (-0.49%), and the 10-year Treasury yield stood at 4.69%. The VIX, the implied volatility index, remained around 16: the market removed geopolitical risk from prices, it did not add fear. Meanwhile, crude oil had only slightly trimmed its decline — WTI at 78.85 dollars (-6.87%), Brent at 83.21 (-5.37%) — without changing the day's overall picture.
Oil in 2026: where we really stand
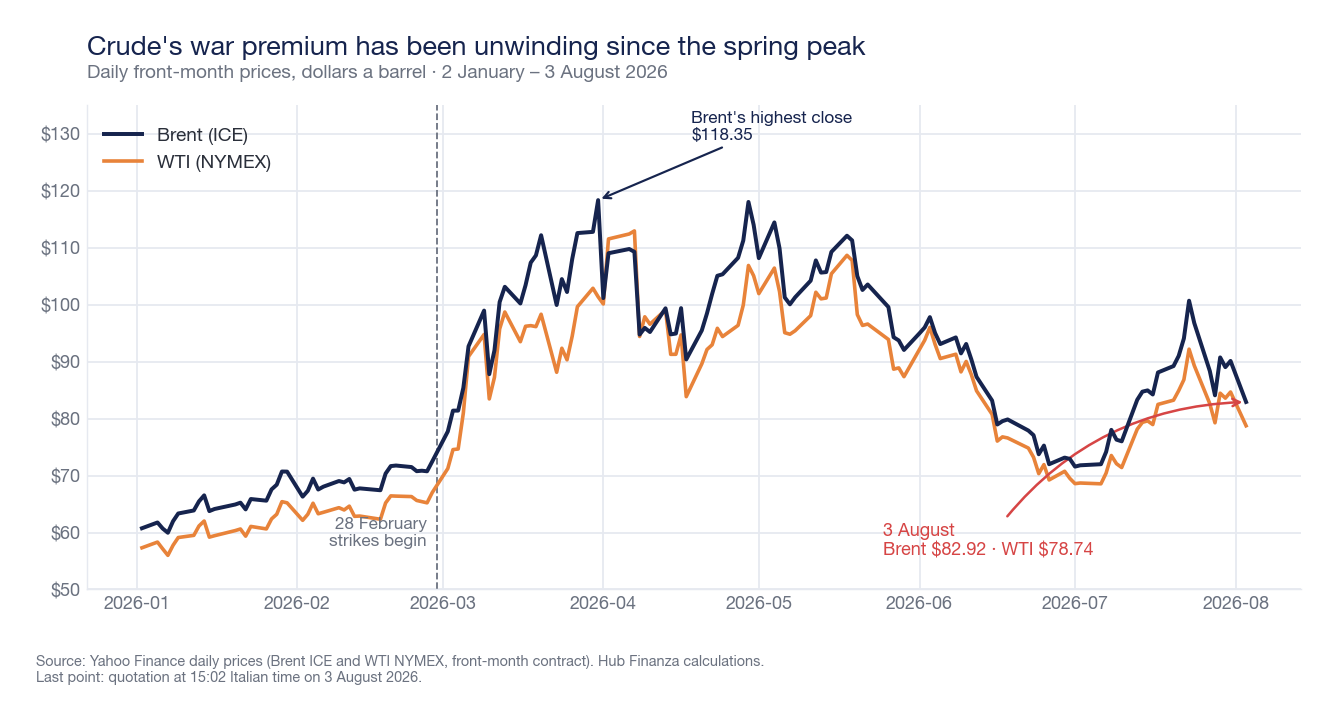
It is worth broadening the perspective, because a -7% by itself tells half the story. On January 2, 2026, Brent closed at 60.75 dollars and WTI at 57.32. With the start of the attacks on February 28, the market's nature changed: in five weeks, Brent reached a close of 118.35 dollars on March 31 — the highest closing price of the year — with intraday peaks up to 126.10 dollars on April 30. Then the slow descent of summer, until the low of July 6 (68.55 dollars for WTI), and finally the new surge in July: last month alone, Brent gained about 25%, following attacks on tankers and the de facto closure of the strait.
Monday's crash, therefore, returns to the markets part of the risk premium accumulated in July, not the entire effect of the war. With Brent at 82.92 dollars, the barrel remains about 36% above early-year levels and about 14% above the February 27 quotation, the last day before the attacks began. Stated differently: the market has removed the hypothesis of a further escalation from the price, not that of an ongoing conflict.
Why Hormuz matters more than any announcement
The Strait of Hormuz is the most critical bottleneck in the global energy system: under normal conditions, about one-fifth of the world's consumed oil and an even higher share of maritime crude oil trade passes through it, in addition to a significant portion of liquefied natural gas. There is no alternative capable of absorbing its volume: pipelines bypassing the strait cover only a fraction.
For months, regular commercial traffic has been effectively halted, and this — more than individual declarations — is why the barrel traded above 100 dollars for most of the spring. A practical consequence for market observers follows: until the strait truly reopens, any decline is reversible. On August 3, the price moved on a promise of negotiation; on the same day, Baghaei recalled that this promise, from the Iranian side, does not yet equate to a commitment to reopen.
In Italy, the barrel crashes, but refuelling does not
This is the point that directly concerns families the most, and it is also where price transmission is slower. According to the survey by the Fuel Price Observatory of the Ministry of Enterprises and Made in Italy, on Monday, August 3, the national average self-service price on the road network was 1.999 euros per liter for gasoline and 2.097 euros for diesel: both in a very slight increase compared to the previous survey, while the barrel was losing seven percentage points. On highways, gasoline cost 2.084 euros and diesel 2.174 euros.
This is not a paradox; it is how the supply chain functions. Crude oil is only one component of the final price, alongside refining, logistics, network margins, and especially taxation (excise duty plus VAT). International prices reach the pump with a delay of days, if not weeks, and the pass-through is traditionally faster on the way up than on the way down. For diesel, moreover, the situation is also fluid for fiscal reasons: with decree-law 133 of July 27, 2026, the Government temporarily reduced the excise duty to 532.90 euros per thousand liters — a discount of 14 cents per liter, 17 cents with VAT — in effect from July 30 to August 6, along with an extraordinary tax credit for road transport. Upon expiration of the measure, without an extension, that discount will be absorbed.
On the consumer price front, ISTAT estimated July 2026 inflation at +2.8% year-on-year, slowing from +3.0% in June, with the monthly index at +0.2%. However, the energy picture remains divided: non-regulated energy products slowed from +13.3% to +10.6%, while regulated energy products accelerated from +9.2% to +14.9%. Core inflation, net of energy and fresh food, remained stable at +1.6%. If the crude oil decline were to consolidate, the effect on Italian price lists would be seen in autumn data, not in August data.
What to watch now
The next trading sessions will be played out on four fronts, each of which can shift the price in either direction.
- The negotiating table. Talks were expected for Monday afternoon, August 3. A joint statement, or the absence of one, will weigh more than any macroeconomic data this week.
- Hormuz. The decisive step is not the announcement of a technical agreement with Oman, but the verifiable resumption of commercial transits. Until then, the risk premium remains in the price, even if reduced.
- OPEC+ supply. The cartel met on Sunday, August 2, and, according to Bloomberg, broadly agreed to a further modest increase in quotas. In a market that has just drained geopolitical oxygen, additional supply pushes in the same downward direction.
- Data and quarterly reports. The week brings new macroeconomic indicators in the United States and a substantial block of corporate results: if the energy decline is coupled with solid data, the market movement finds confirmation; otherwise, it quickly deflates.
For investors, the lesson of the day is less spectacular than the headline suggests: a market that moves 7% on one statement is a market that can also move 7% on the next statement. Energy volatility did not extinguish on August 3; it merely changed its sign.
Sources
Market quotations surveyed on Yahoo Finance on August 3, 2026, at 3:02 PM Italian time (WTI September contract, Brent October contract, stock indices, 10-year Treasury, gold, RBOB, TTF). News and statements: CNBC, The Sunday Guardian, The Week, Al Jazeera, The Tribune, Bloomberg. Comparison between CFD and futures: TradingKey. Fuel prices: Fuel Price Observatory of the Ministry of Enterprises and Made in Italy, August 3, 2026, survey reported by ANSA. Fiscal measures: Ministry of Economy and Finance communiqué of July 27, 2026 (decree-law 133/2026). Consumer prices: ISTAT, preliminary estimates for July 2026 (July 31, 2026). Context on the Strait of Hormuz: Brookings. Hub Finanza charts are elaborations by the editorial team based on the data cited in the respective captions.
This article is for informational purposes only and does not constitute financial advice, a solicitation for public savings, or an investment recommendation. Prices of raw materials and financial instruments cited are subject to sharp fluctuations, and past performance is not indicative of future returns. Before making any investment decision, it is advisable to consult a qualified advisor.