

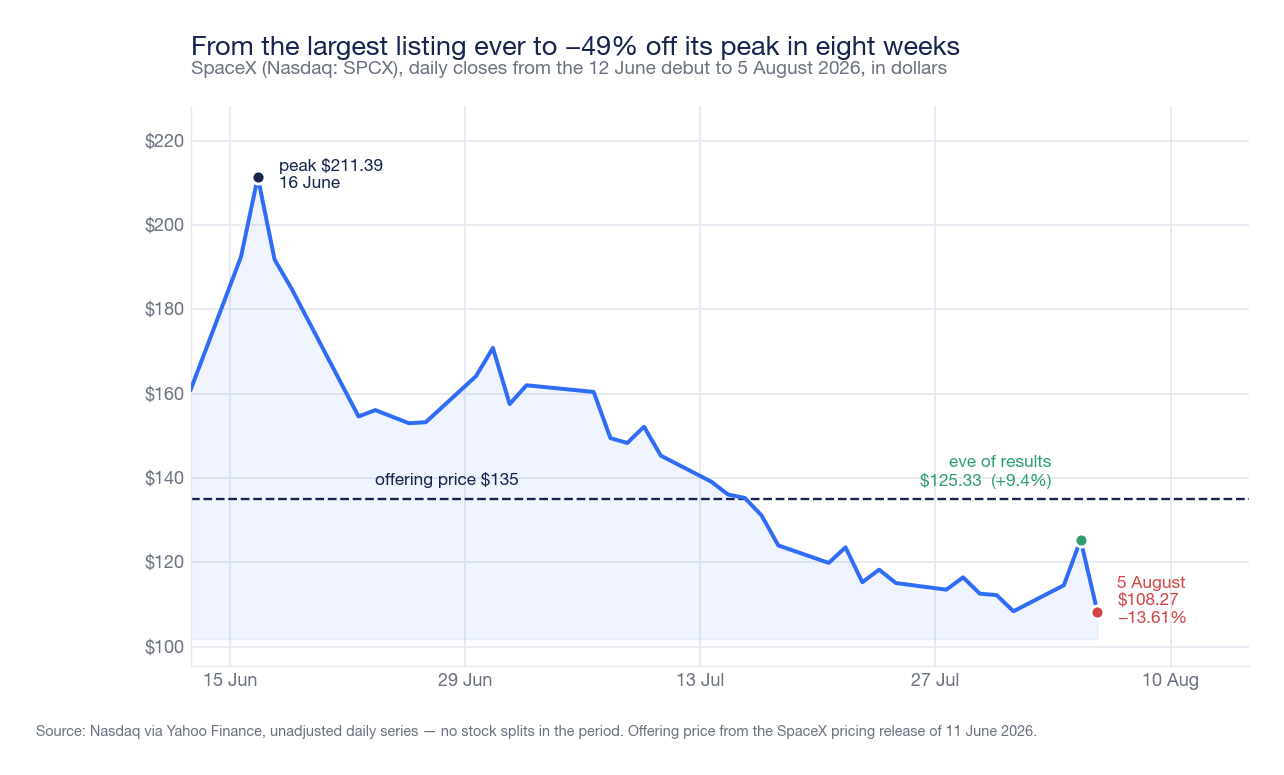
SpaceX beat estimates and lost 13.61% in one trading session. On August 4, 2026, after markets closed, the company published its first quarter as a listed entity: revenue of 7.814 billion dollars, up 92% from 4.071 billion a year earlier and nearly 15% above the consensus of 6.81 billion collected by S&P Global Market Intelligence. Net loss decreased from 1.008 billion to 541 million, and loss per share from 0.34 to 0.09 dollars against an expected 0.26. The next day, the stock closed at 108.27 dollars, compared to 125.33 the previous day.
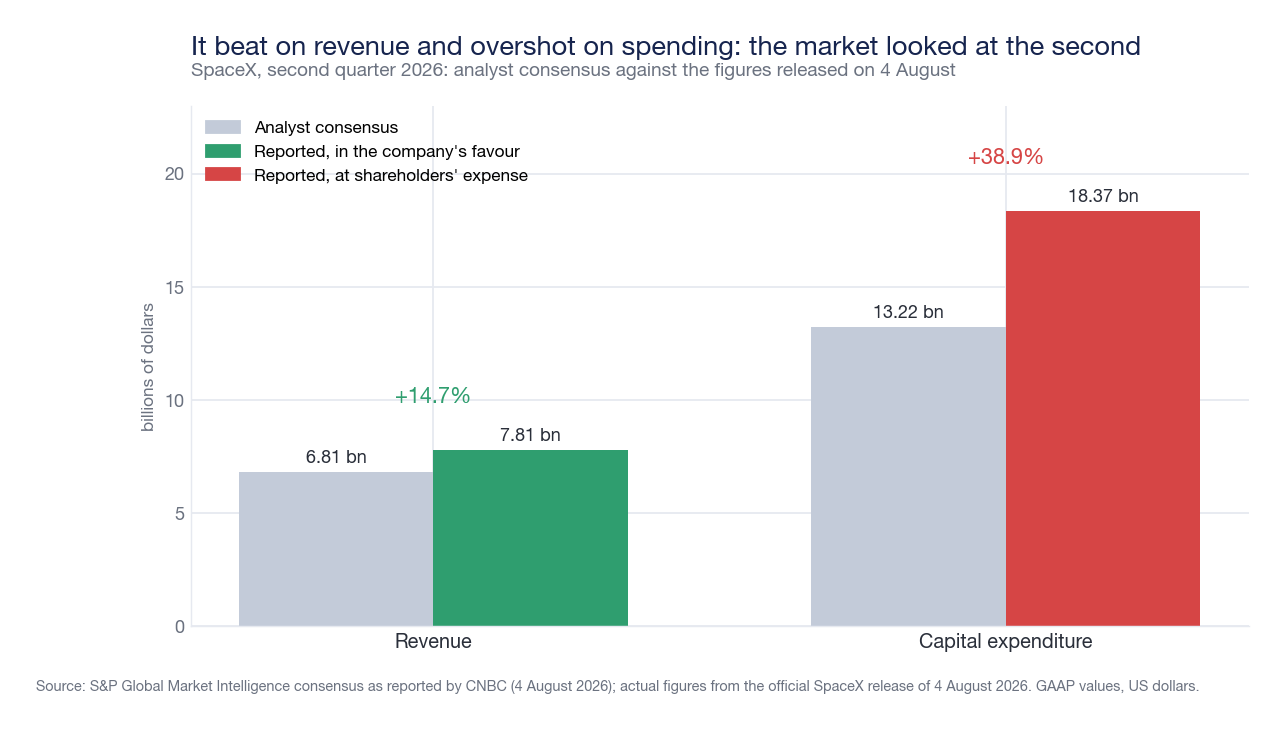
This is the kind of session that disproves the most common idea in markets: that a stock's movement after earnings is driven by the earnings themselves. In this case, the number that decided the day was not in the income statement but in the investment statement — 18.369 billion dollars in three months, compared to the 13.22 expected by analysts and 2.825 in the same quarter of 2025. And it wasn't the only event on the calendar: on August 6, the following day, the lock-up period preventing historical shareholders from selling shares expired.
The paradox of the quarter: beating on revenue, overshooting on spending
The results for the second quarter of 2026, ended June 30, are better than expected on every line of the income statement. Adjusted EBITDA — a non-GAAP measure, reconciled in the press release — rose 191% to 3.538 billion from 1.214. Operating loss decreased from 970 to 143 million. The company closed the quarter with 100 billion dollars in cash, equivalents, and marketable securities, and an order backlog of 47.5 billion.
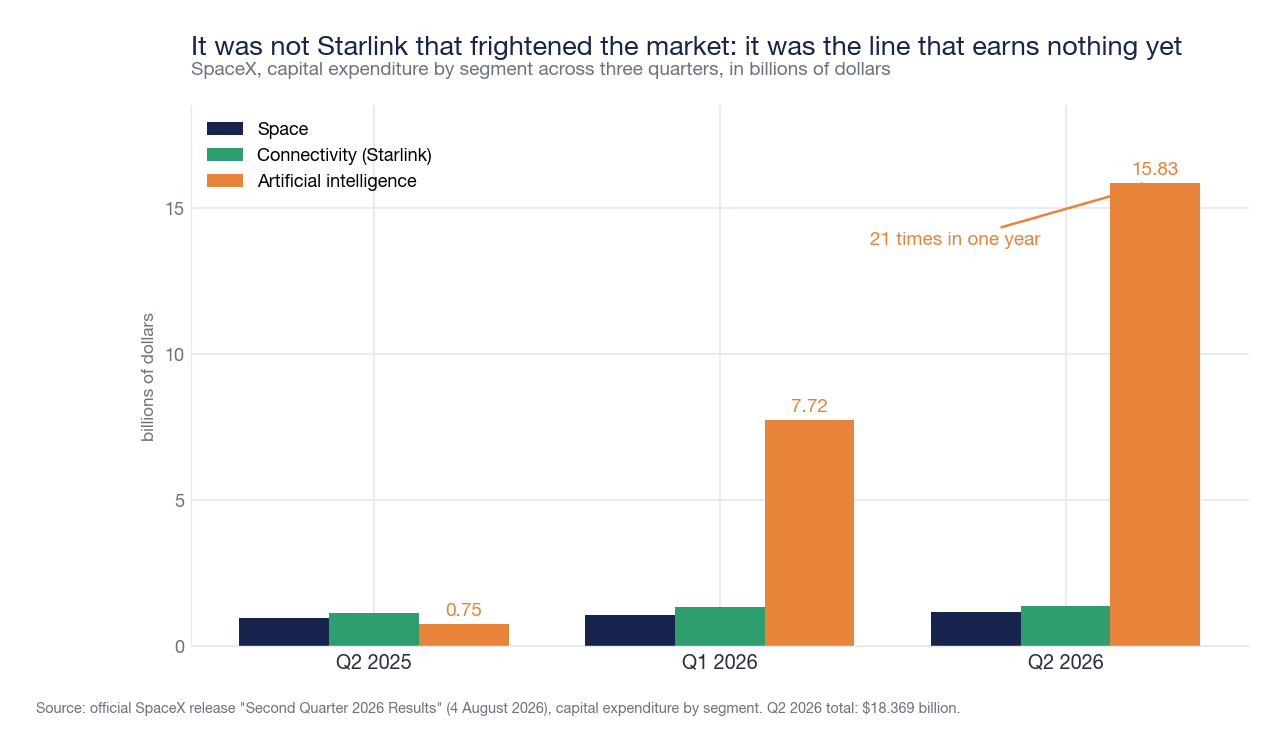
The investment chapter tells another story. The 18.369 billion dollars spent in the quarter are 2.35 times the revenue for the same period: for every dollar earned, SpaceX committed over two to plants and infrastructure. The sequential comparison is equally stark — 10.107 billion in the first quarter, almost double in the second. The gap compared to consensus is an excess of 38.9%, and it is a gap that no positive revenue surprise could compensate, because it acts on a different item: not on what the company earns today, but on how much capital it will need before earning tomorrow.
Starlink did not disappoint: it paid the bill for others
The interpretation circulated in the early hours — a misstep by Starlink — does not hold up when compared with segment tables. The Connectivity division generated revenue of 4.291 billion, up 66% year-on-year and 32% quarter-on-quarter, with an operating profit of 1.656 billion, an increase of 79%: an operating margin of 38.6%. Starlink subscribers doubled in twelve months to 12.0 million, with 1.7 million added in the quarter alone. The enterprise and public administration component grew by 108% to 1.806 billion, supported by over 6 billion in multi-year contracts with the US government for Starshield and agreements with American Airlines, Southwest, Virgin Atlantic, SoftBank, and NTT Docomo.
The only data point that lends itself to a negative interpretation is the average revenue per subscriber, which fell from 85 to 66 dollars per month in one year: −22%. But it is the same value as the first quarter of 2026, thus stable for six months, and its annual decline is the arithmetic effect of the doubling of the customer base towards international markets and cheaper plans. An average revenue that falls while subscribers double and the operating margin rises by 79 percentage points is not a deterioration: it is a mix.
The real cost center is elsewhere. The Artificial Intelligence division generated 2.561 billion in revenue and an operating loss of 1.257 billion, and absorbed 15.828 of the 18.369 billion in investments for the quarter: 86% of the total. Twelve months earlier, the same item was 749 million. This is a twenty-one-fold multiplication in four quarters. In practice, the cash-generating segment — connectivity — is funding the one that burns cash, and the market wanted to know for how much longer.
The measure the market didn't buy
The headline of the press release is adjusted EBITDA: 3.538 billion, almost tripled. The operating result for the same quarter is a loss of 143 million, and the net result is a loss of 541 million. The distance between the two measures — just over 4 billion — is not an accounting detail: it is exactly what the market decided not to trust.
The reconciliation published by the company shows it line by line. To net income, 2.848 billion in depreciation and amortization (it was 1.526 billion a year earlier, +87%) and 831 million in stock-based compensation (+79%) must be re-added, along with 629 million in financial charges, partly offset by 340 million in interest income on liquidity. The point is that depreciation and amortization is how yesterday's investments enter the income statement: excluding it, in a company that has just spent 18.4 billion in a quarter, means measuring profitability net of precisely the item that worries. It is a legitimate measure, declared as non-GAAP, but for a professional reader, it is not the one that decides.
Stock-based compensation deserves a separate line: 831 million is 10.6% of the quarter's revenue. It does not result in cash outflow, but it does result in value dilution for existing shareholders, and this dilution is in addition to what already occurred with the listing — the average shares used for calculating loss per share increased from 2.929 to 5.864 million in twelve months, exactly double. A loss per share that improves from 0.34 to 0.09 dollars with the denominator doubled indicates a real improvement, but less extensive than the variation alone suggests.
On the opposite front, the financial structure is solid and must be stated with the same precision: cash and equivalents increased from 24.747 billion at the end of 2025 to 93.522 billion as of June 30, an effect of fundraising, and bond debt has very long maturities — until 2046 and 2056 — at rates between 5.35% and 6.65%. This profile allows for long-term financing of an aggressive investment plan. The question the market asked itself on August 5 was not whether SpaceX can afford this expenditure, but for how many more quarters it will have to sustain it before it generates margin.
The day after: the expiration that no balance sheet could compensate
There is a calendar element that explains why the reaction was so widespread on that particular day. August 6 marked the expiration of the lock-up period of the listing: the contractual restriction preventing historical shareholders, employees, and pre-IPO investors from selling in the first few months after listing. At expiration, according to the prospectus conditions reported by the financial press, the number of effectively tradable shares could more than quadruple.
An increase in the free float does not change the company's value: it changes how many shares exist on the market compared to how many buyers want. Those who had to decide whether to remain exposed did so knowing that the next day potential supply would suddenly increase, and that selling later would be more expensive than selling earlier. Volumes confirm this: on August 5, 206.6 million shares changed hands, three times the average of the previous twenty sessions (68.2 million). This is not the volume of those reacting to an earnings number; it is the volume of those repositioning a portfolio.
Why the offering price is not a value
The case serves to clarify a misunderstanding that accompanies almost all large listings. SpaceX placed 555,555,555 Class A shares at 135 dollars on June 11, 2026, raising approximately 75 billion: the largest operation in history. The next day, the stock opened at 150 dollars and closed at 160.95, 19.2% above the offering. On June 16, it touched 225.64 dollars during the session.
Those numbers were not a measure of the company's value, but the equilibrium price between enormous demand and deliberately restricted supply. In the first few weeks, available shares are a fraction of the capital: the rest is locked up. Placing agents also have the right to stabilize the price in the first few days by exercising the overallotment option. Analyst coverage is still thin, and comparison with results is not yet possible because results are not yet available. In that context, the price expresses expectations, not fundamentals.
The first quarterly report is the moment when this mechanism reverses: numbers arrive, the share lock-up expires, scarcity ends. From a maximum closing of 211.39 dollars on June 16 to 108.27 on August 5, the loss is 48.8%; from the offering price, 19.8%. The company does not need to have deteriorated for this to happen: it is enough that the initial price incorporated a scenario that the first data did not confirm. This is the decisive and often overlooked difference between the quality of a company and the convenience of the price at which it is bought.
From 75 to 240 dollars: how little is known about a newly listed company
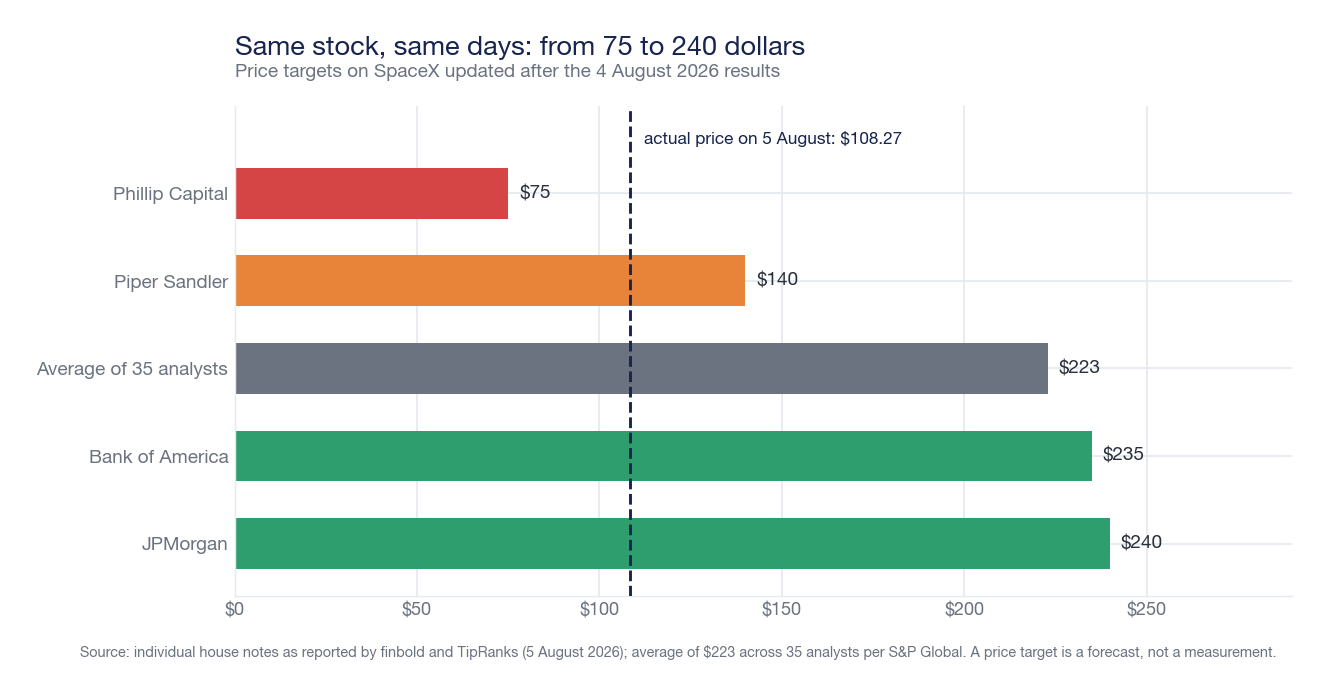
The most honest measure of uncertainty about SpaceX is not stock volatility: it is the disagreement among those covering it. In the days following the earnings report, Phillip Capital indicated a target of 75 dollars; Piper Sandler cut it from 156 to 140 with a neutral rating; Bank of America confirmed a buy with a target of 235; JPMorgan raised it from 225 to 240. The average of the 35 analysts surveyed by S&P Global is 223 dollars.
For the same stock, in the same days, with the same public data, the highest target is 3.2 times the lowest. Such a dispersion for a mature company would be an anomaly; for a newcomer, it is the norm, and it says something precise: no one yet has a sufficient historical series to estimate how long the investment phase will last, what margin will support the business when it ends, how much capital will be needed in the meantime. A price target, under these conditions, is a forecast, not a measure.
Not an isolated case: the season of spending watchdogs
SpaceX is the most extreme case, not the first. In the preceding weeks, large technology companies showed the same pattern: better-than-expected results, declining stocks, and in between, always the same item. Alphabet lost over 7% after raising projected investments to 205 billion dollars and recording negative free cash flow for the first time since its 2004 listing, despite an 82% growth in cloud revenue. Microsoft increased investments by 84% against a 40% growth in Azure. Meta raised them by 47% against 33% revenue growth, with an artificial intelligence spending forecast reaching 135 billion in 2026.
The common denominator is that spending grows faster than the revenue that should justify it. As long as the market considered investment in artificial intelligence a sign of ambition, that gap was rewarded; since this earnings season, it has been discounted. The change does not concern the individual companies' financial statements but the criteria by which they are interpreted — and that is why it affects very different companies simultaneously.
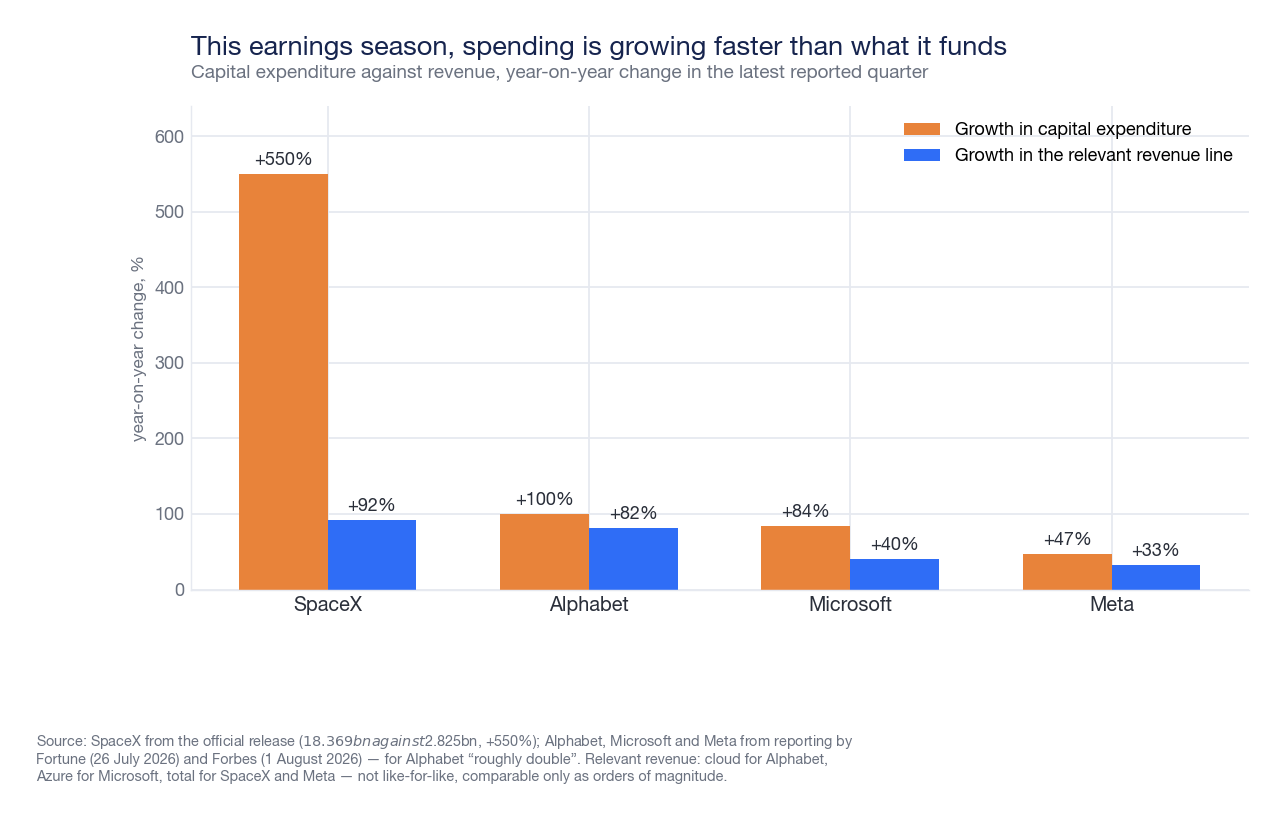
SpaceX's position within this pattern, however, is peculiar for two reasons. The first is dimensional: a ratio of investments to revenue of 2.35 times has no parallel among the cited companies, which remain largely profitable while spending. The second is historical: Alphabet, Microsoft, and Meta have twenty years of public financial statements and stable shareholders, and can afford to ask for trust based on what they have already demonstrated. SpaceX has one quarter.
What distinguishes a negative reaction from a negative result
It's worth fixing the point, because it's why a hasty reading of this session leads astray. SpaceX's quarter is, strictly speaking, good: revenue almost doubled and above estimates, loss halved, improving margins, a segment generating 2.6 billion in adjusted EBITDA, 100 billion in liquidity. The stock lost 13.61% not because those numbers were weak, but because the price incorporated better ones and because two elements external to the income statement — the magnitude of future spending and the expiration of the share lock-up — weighed more than the results.
The distance that matters, for an investor, is not between results and zero: it is between results and what was already discounted in the price. These are two different measures, and the second is not publicly disclosed anywhere. It can only be reconstructed by looking at how much the stock had risen before the announcement — in SpaceX's case, 9.4% in the August 4 session alone, on top of a 5.7% rise the day before — and what assumptions were needed to justify that level.
What to watch in the coming quarters
Four indicators will tell if the correction was a valuation adjustment or the start of an industrial problem. The first is the spending profile: the company has not indicated a cap, and the third quarter of 2026 — expected in autumn — will tell if the 18.4 billion is a peak related to infrastructure startup or the new baseline. The second is the average revenue per Starlink subscriber: stable at 66 dollars for two quarters, this is the data that separates quality growth from growth bought at a discount.
The third is the profitability of the artificial intelligence segment, currently at an operating loss of 1.257 billion on 2.561 billion in revenue: cloud service agreements already contracted for 14.1 billion indicate demand, but not yet a margin. The fourth is the absorption of the free float released on August 6, which is measured by subsequent weeks' volumes, not a single session. To these is added the verification of the 60 billion dollar operation announced for Cursor, which, if concluded, would substantially change the group's financial profile.
Meanwhile, the most useful fact of this story remains, and it applies far beyond SpaceX: in the first few weeks after a listing, the price does not measure the company, it measures expectations about it. The two values coincide only when enough quarters arrive to compare them. On August 4, one arrived.
Sources
Second quarter 2026 data from the official press release SpaceX Reports Second Quarter 2026 Results, published on August 4, 2026, at ir.spacex.com: revenue, operating profit, adjusted EBITDA, and segment investments, Connectivity division operating data, non-GAAP reconciliations. Values are in US dollars and refer to the quarter ended June 30, 2026, compared to the quarter ended June 30, 2025, unless otherwise indicated; segment sums have been verified (962 + 4.291 + 2.561 = 7.814 in revenue; 1.174 + 1.367 + 15.828 = 18.369 in investments). Pre-quarter consensus estimates — 6.81 billion in revenue, 13.22 billion in investments, loss per share of 0.26 dollars — from S&P Global Market Intelligence, reported by CNBC and CNN Business (August 4, 2026). Offering price of 135 dollars, 555,555,555 Class A shares, and approximately 75 billion raised from SpaceX's pricing announcement on June 11, 2026, with debut reports from CNBC, Forbes, and TechCrunch (June 11-12, 2026). Lock-up conditions and calendar from the listing prospectus, reported by financial press (July-August 2026). Quotations, volumes, and percentage changes from Nasdaq daily series via Yahoo Finance, unadjusted: the stock has not undergone splits since listing, so closing prices are comparable to the offering price. Post-quarter price targets from individual firm notes reported by finbold and TipRanks; average of 223 dollars across 35 analysts according to S&P Global. Data on investments and revenue for Alphabet, Microsoft, and Meta from Fortune (July 26, 2026) and Forbes (August 1, 2026) reporting. Ratios between investments and revenue, segment margins, volume multiples of the twenty-session average, and changes from highs are editorial elaborations based on cited data.
This article is for informational purposes only and does not constitute financial advice, investment research, public solicitation of savings, or a personalized recommendation to buy or sell. The evaluations expressed are editorial opinions based on public data as of the publication date and may change without notice. The value of investments can decrease as well as increase, and past performance is not indicative of future results. Before making any investment decision, it is advisable to consult a qualified financial advisor and assess the consistency of the operation with one's objectives, time horizon, and risk tolerance.