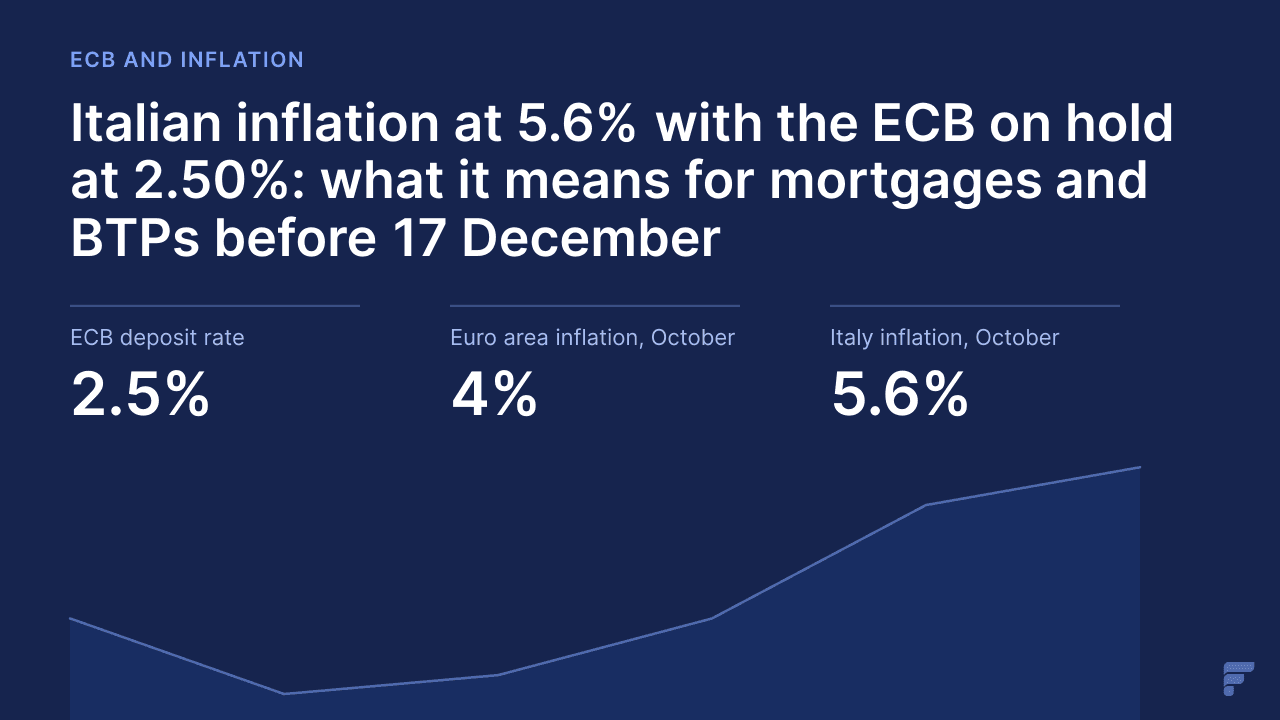

At its meeting on 29 October 2026 the European Central Bank (ECB) left all three rates unchanged: the deposit rate at 2.50%, the main refinancing rate at 2.65% and the marginal lending rate at 2.90%, in force since 16 September. In October, inflation is 4.0% in the euro area and 5.6% in Italy (Eurostat flash estimate).
The Governing Council will decide again at the end of the monetary policy meeting on 16 and 17 December in Frankfurt, with the press conference on Thursday 17 December. This analysis was written before that decision, on Friday 13 November, and does not anticipate its outcome.
The figure that changes the outlook for Italy comes from the flash estimate of the European Union's statistical office (Eurostat) of 4 November 2026. According to Eurostat, harmonised inflation in Italy rose from 4.2% in September to 5.6% in October, while in Germany it fell from 3.3% to 2.8%. The ECB rate is one for 21 countries; its real weight is not.
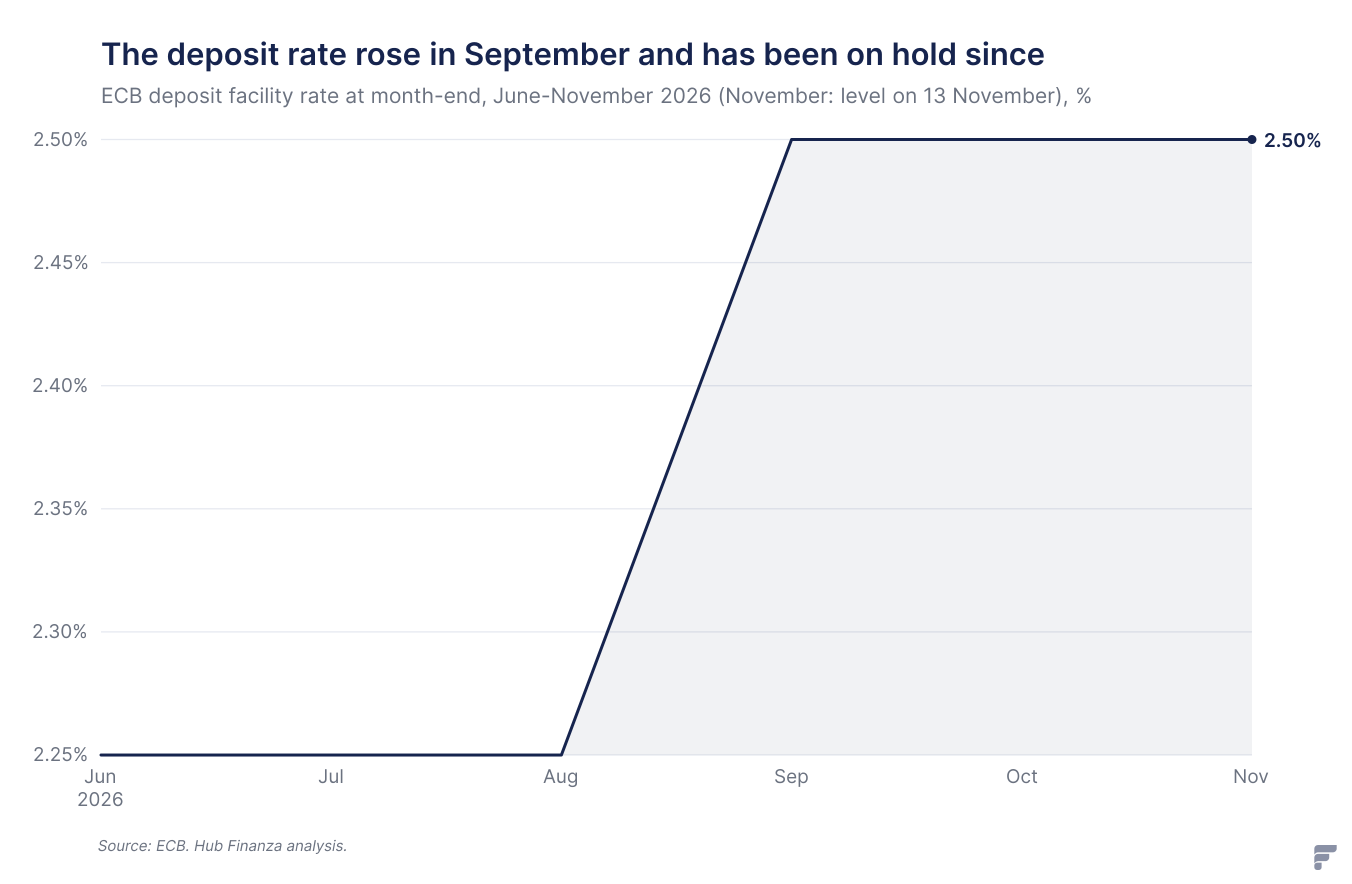
The ECB has held deposit rates at 2.50% since 16 September, after two hikes in three months
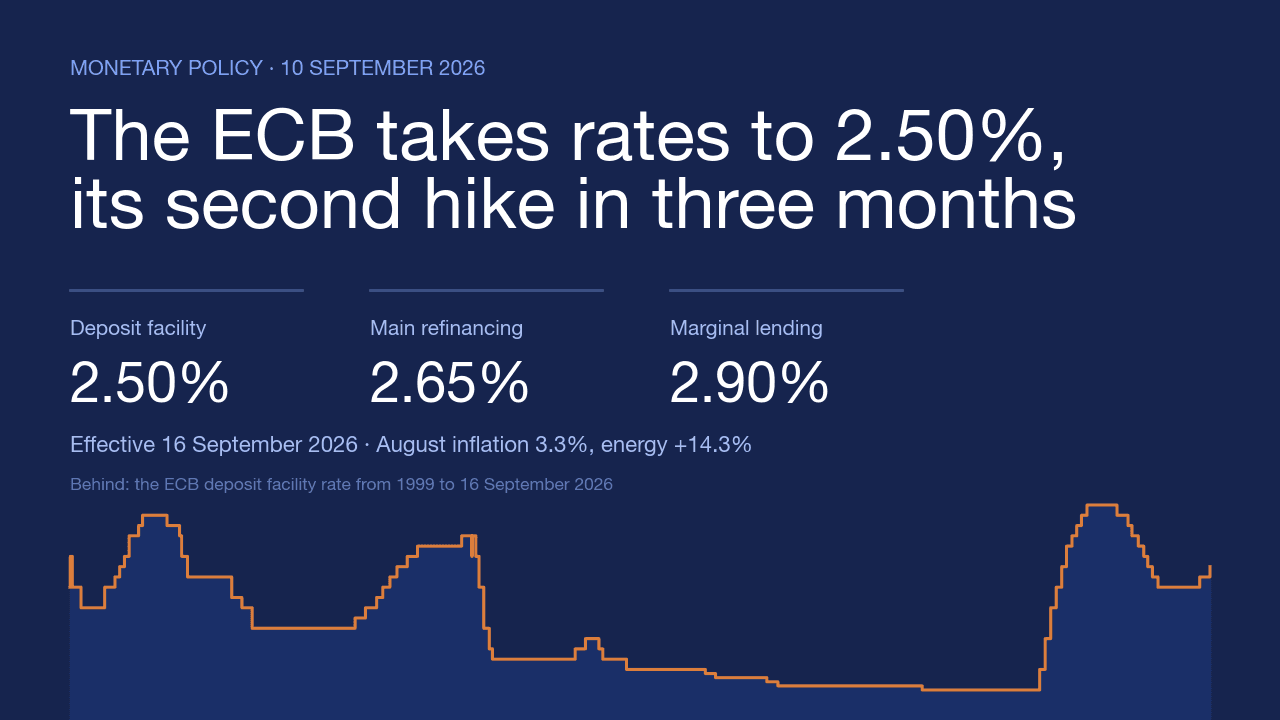
The ECB's three key rates have been unchanged since 16 September 2026, the date the latest hike took effect, and on 29 October the Governing Council confirmed them. According to the ECB press releases of 10 September and 29 October 2026, the levels are:
- deposit facility rate: 2.50%;
- main refinancing operations rate: 2.65%;
- marginal lending facility rate: 2.90%.
Getting here took two moves of 25 basis points each. On 11 June 2026 the ECB raised rates to 2.25% (deposit), 2.40% (main refinancing) and 2.65% (marginal lending), in force from 17 June. The reason given in the press release was the inflationary pressures generated by the war in the Middle East.
On 10 September 2026 the ECB added another 25 basis points to all three rates, effective 16 September. The 2026 tally, derived from the two press releases, is simple: the ECB deposit rate has risen by 0.50 percentage points, from the 2.00% in force until 16 June to the current 2.50%.
Of the three, the rate that matters most for households and businesses is the deposit rate. It is the remuneration banks receive on liquidity left with the Eurosystem and, with abundant liquidity, it acts as a floor for money market rates, to which indices such as Euribor are linked. The mechanism is explained in our guide on how monetary policy reaches mortgages, bonds and currencies.
In the 10 September decision, covered in this article, the ECB justified the hike with the conflict in the Middle East, which continues to generate price pressures, and with inflation set to remain well above target for a long time. In the same press release it specified that it is not pre-committing to any particular rate path.
On 29 October the ECB paused because energy pushes prices up but holds back growth
The pause of 29 October 2026 stems from a two-sided risk. According to the Governing Council's press release, there are four reasons for the decision:
- energy prices have continued to rise, with upside risks to inflation and downside risks to growth;
- underlying inflation has so far remained broadly stable;
- wages show no significant reaction for now;
- financing conditions have tightened since the September meeting and, according to the ECB, this will probably weigh on both inflation and growth.
In the same 29 October press release the ECB wrote that the greater intensity and duration of the energy shock, together with indirect and second-round effects, will probably push inflation up and growth down. It also reaffirmed its commitment to stabilising inflation at the 2% target over the medium term.
Read together, the list explains the choice to wait. Two elements act as a brake: underlying inflation is not accelerating and wages are not chasing prices, meaning the spiral a central bank fears most is not yet visible in the data cited by the ECB.
A third element works in place of the Governing Council: if credit has already become more expensive, part of the tightening has arrived without a new hike. This is our reading of the press release, not an ECB formula.
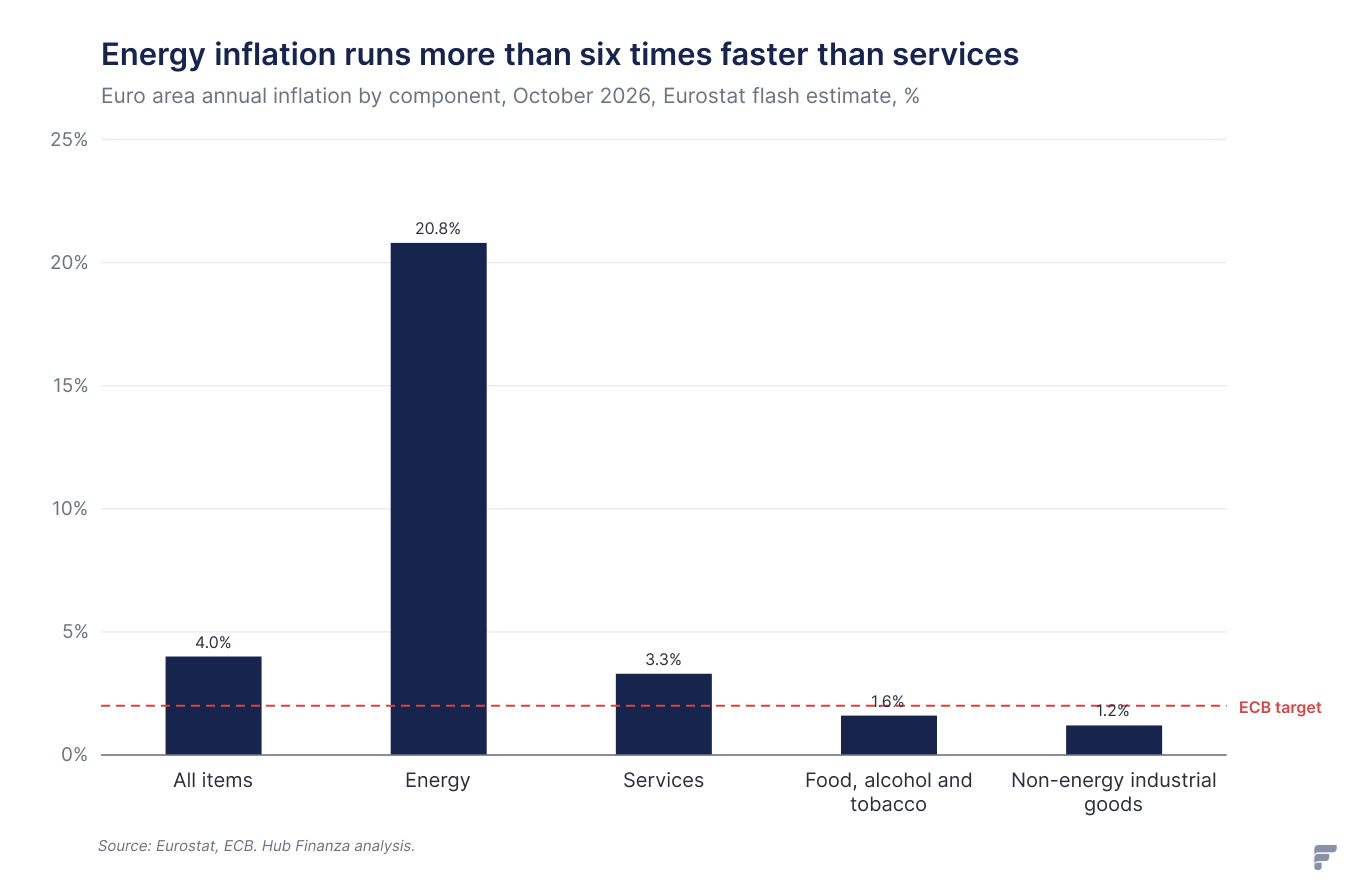
The fourth element, energy, points in the opposite direction and is the one keeping the December file open. In the Eurostat flash estimate for October 2026 the gap between energy and the rest of the basket is sharp: energy runs at 20.8% a year, services at 3.3%, food at 1.6%, non-energy industrial goods at 1.2%.
Euro area inflation is 4.0%, double the target, and almost half comes from energy
According to the Eurostat flash estimate of 4 November 2026, annual euro area inflation as measured by the harmonised index of consumer prices (HICP) is 4.0% in October 2026, up from 3.8% in September. That is double the ECB's 2% target, 2.0 percentage points above. In October 2025, according to the same Eurostat table, it was 2.1%.
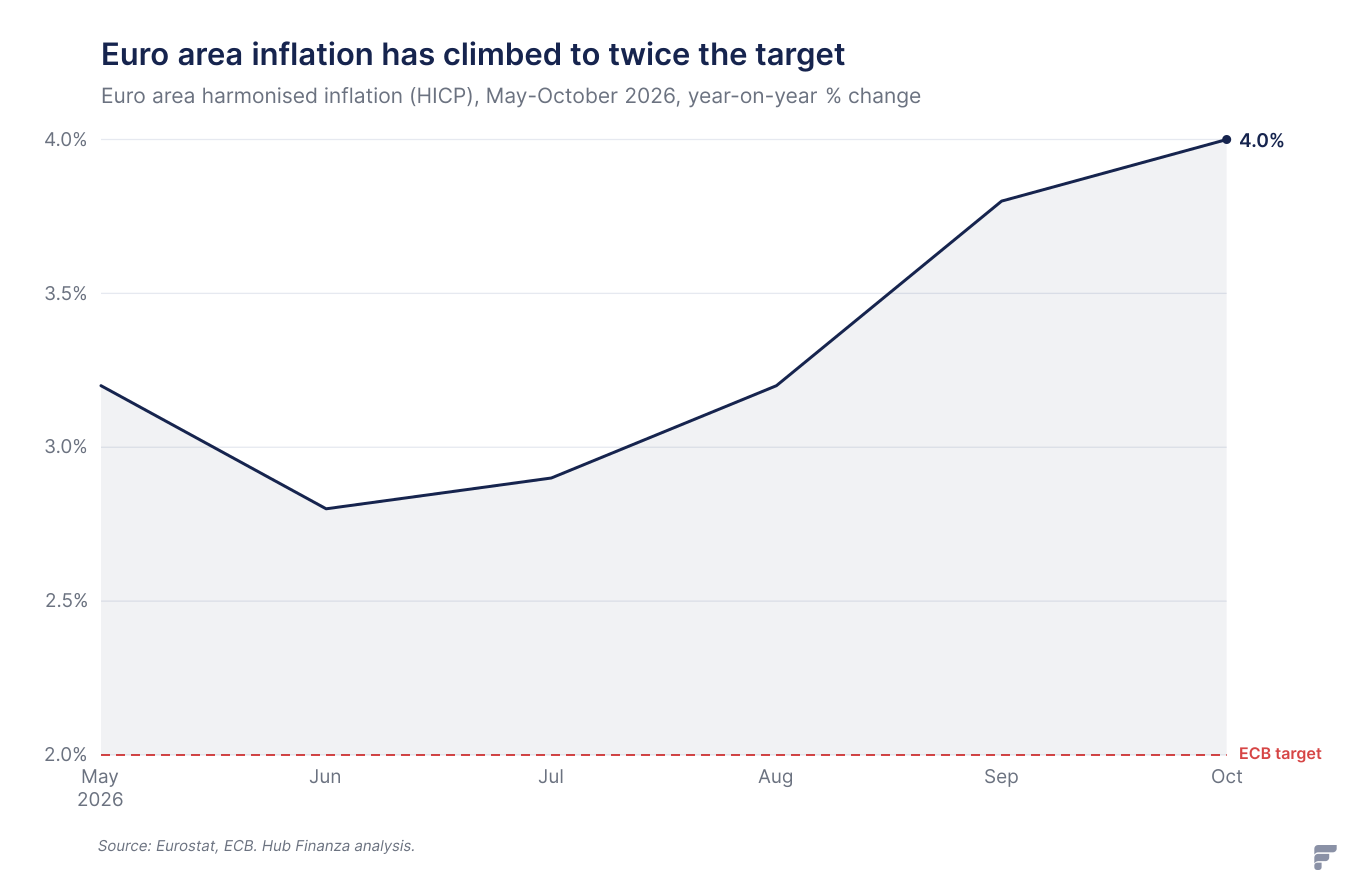
On a monthly basis, euro area consumer prices rose by 0.4% between September and October 2026, according to Eurostat. The perimeter is the enlarged one: since 1 January 2026 the euro area also includes Bulgaria, for a total of 21 countries.
The components, according to the Eurostat flash estimate for October 2026, describe a two-speed inflation:
- energy: 20.8%, from 18.9% in September;
- services: 3.3%, from 3.2%;
- food, alcohol and tobacco: 1.6%, from 1.3%;
- non-energy industrial goods: 1.2%, from 1.1%;
- excluding energy, food, alcohol and tobacco (underlying inflation): 2.5%, unchanged from September;
- excluding energy alone: 2.3%.
How much energy weighs on the overall figure can be estimated with a simple calculation on Eurostat data. In the 2026 HICP basket, energy accounts for 90.3 per thousand, about 9%: multiplied by the 20.8% annual rate, it gives a contribution of about 1.9 percentage points to the 4.0% total.
Almost half of October 2026 euro area inflation therefore comes from less than a tenth of the basket. The calculation is approximate, but it is consistent with the 2.3% that Eurostat records excluding energy: the remaining 91% of the basket, at that pace, contributes about 2.1 points.
It is the same picture described by the ECB on 29 October: headline inflation driven by energy and stable underlying inflation. The issue for the Governing Council is how long the two figures will remain apart.
Indirect effects, meaning energy passing through into transport costs, services and goods prices, are exactly what the press release identifies as a risk. To revisit how the index is built, see our guide on what inflation is and how it is measured.
The October estimate is still provisional: Eurostat will publish the full October 2026 inflation data on Wednesday 18 November.
Italy at 5.6%: the same ECB rate weighs very differently across the 21 countries
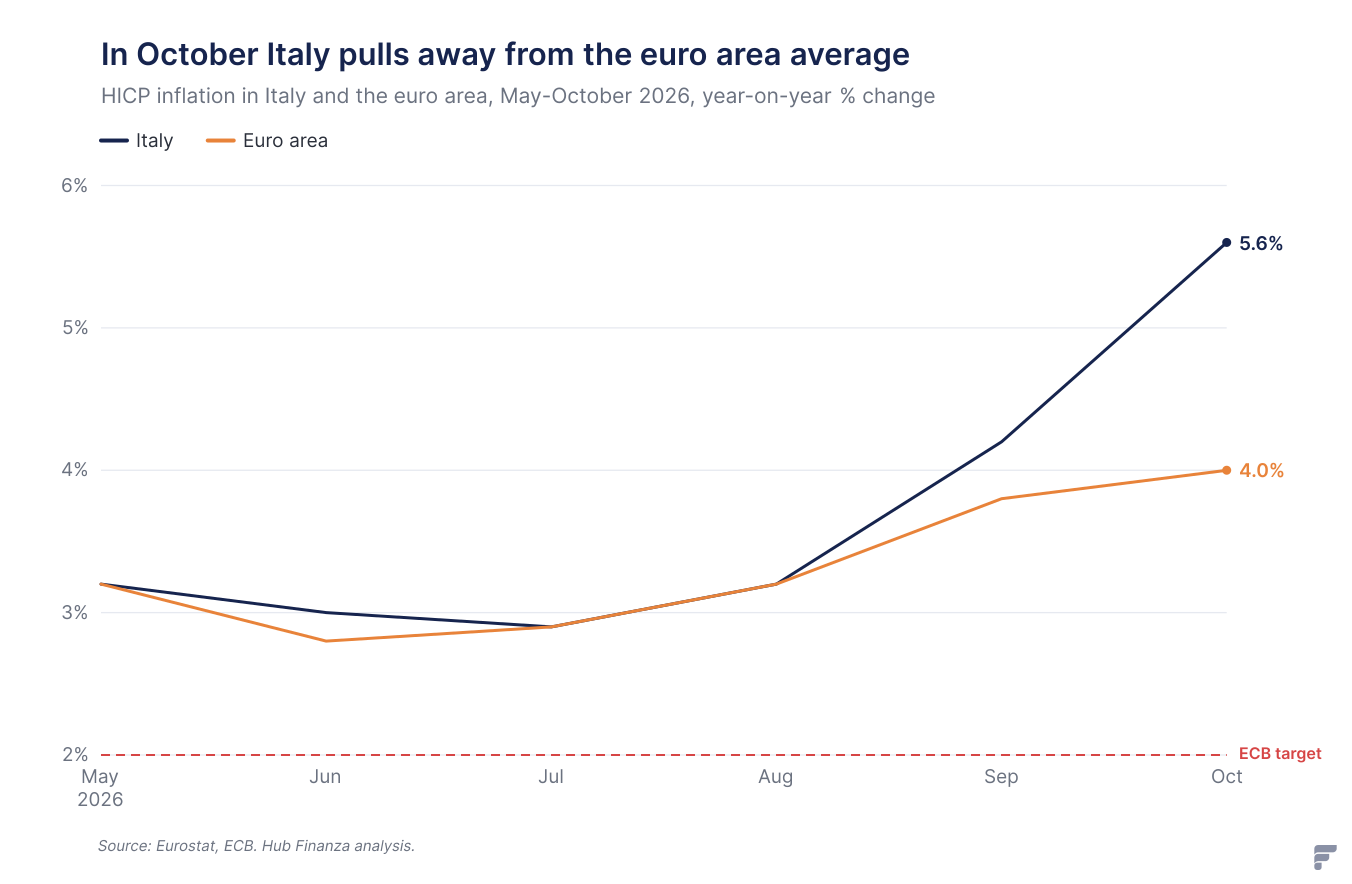
According to the Eurostat flash estimate of 4 November 2026, harmonised inflation in Italy is 5.6% in October 2026, from 4.2% in September: 1.4 points more in one month and 1.6 points above the euro area average. On a monthly basis, again according to Eurostat, prices in Italy rose by 1.2%, three times the area's +0.4%.
The comparison with the other large countries, from the Eurostat flash estimate for October 2026:
- Italy: 5.6% (4.2% in September);
- Spain: 4.9%;
- France: 3.8%;
- Germany: 2.8% (3.3% in September).
In one month the gap between Italy and Germany has gone from 0.9 to 2.8 percentage points: in October 2026 Italian inflation is double the German rate. The two economies have moved in opposite directions, the first accelerating, the second slowing.
The breakdown by component will come with the full Eurostat data on 18 November. Until then, attributing the Italian jump to a single item in the basket would be conjecture.
This divergence matters for monetary policy. The ECB sets a single rate and looks at inflation in the euro area as a whole, not at that of individual countries. The same 2.50%, however, has a different intensity depending on local inflation.
A rough measure is the ex post real rate: the ECB deposit rate minus October 2026 inflation. The calculation, on ECB and Eurostat data, gives:
- Italy: 2.50% − 5.6% = −3.1 points;
- Spain: 2.50% − 4.9% = −2.4 points;
- euro area: 2.50% − 4.0% = −1.5 points;
- France: 2.50% − 3.8% = −1.3 points;
- Germany: 2.50% − 2.8% = −0.3 points.
It is a rudimentary indicator: it uses current rather than expected inflation and a single month of data, moreover provisional. It should be read as a hint, not as a measure of monetary policy. But it conveys the distance between countries.
With Italian inflation at 5.6% in October 2026, the real cost of money in Italy remains negative and more negative than in Germany. For Italian households the main problem is not the ECB rate itself, but purchasing power: a 1.2% rise in prices in a single month erodes wages, pensions and savings that do not adjust to inflation.
Will the ECB raise rates again on 17 December?
It is not decided: the ECB has not announced a December move and, in the 10 September 2026 press release, stated that it is not pre-committing to a rate path. The decision will come at the end of the Governing Council meeting of 16 and 17 December 2026 in Frankfurt, with the press conference on Thursday 17 December.
The picture, separated by degree of certainty:
- confirmed by the ECB calendar: the monetary policy meeting is held on 16 and 17 December 2026; the next is set for 3 and 4 February 2027;
- confirmed by Eurostat: the full October 2026 inflation data are released on 18 November;
- confirmed by ECB press releases: rates are unchanged at 2.50%, 2.65% and 2.90%; the Governing Council sees upside risks to inflation and downside risks to growth;
- not confirmed: the outcome of 17 December, which no official document anticipates.
The October figure lends itself to two readings, both grounded in the same documents. The Governing Council will have to weigh them against each other.
The arguments for another hike
- euro area inflation rose from 3.8% in September to 4.0% in October 2026 and remains at double the target (Eurostat);
- energy accelerated from 18.9% to 20.8% a year, and the ECB itself wrote on 29 October that a more intense and longer shock will probably push inflation up;
- services, the item most tied to labour costs, rose from 3.2% to 3.3%;
- in Italy (5.6%) and Spain (4.9%) October inflation is well above the area average.
The arguments for waiting
- underlying inflation is steady at 2.5% in October 2026, unchanged from September (Eurostat);
- according to the 29 October press release, wages show no significant reaction for now;
- financing conditions have already tightened and, according to the ECB, will weigh on inflation and growth;
- in Germany inflation fell from 3.3% to 2.8% between September and October 2026.
Any reading that takes the December outcome for granted, one way or the other, remains a hypothesis. The full data of 18 November will show whether energy is passing through into the other items in the basket, which is the point on which the ECB has concentrated its concerns.
For mortgages and BTPs, the tightening comes through markets, not only ECB meetings
For households and the Treasury, the effect of monetary policy arrives through market rates, which move on expectations before the Governing Council decides. The ECB itself acknowledges this when it writes, on 29 October 2026, that financing conditions have tightened since the September meeting, without any new hike in the meantime.
Those who already have a variable-rate mortgage
The rate on a variable-rate mortgage has two parts: a market index, usually the one- or three-month Euro interbank offered rate (Euribor), plus a fixed spread set in the contract. The spread does not change; the index does, on the reset dates set out in the contract.
Euribor reflects the cost of money between banks and expectations of ECB rates in the following weeks. For this reason it tends to move ahead of meetings, not on the day of the decision: an expected hike can enter the index before it arrives, and a hike that does not arrive can make it retreat.
In general terms, the June and September 2026 hikes have already been passed on, in whole or in part, to instalments reset after those dates. How much and when depends on the contract, the index maturity and the reset date.
Calculation example: a mortgage with 150,000 euros of outstanding principal, 20 years of remaining term, French-style amortisation (constant monthly instalment) and a hypothetical overall rate of 4.00% a year, index plus spread. It is assumed that the index rises by 0.25 or 0.50 points and that the increase passes entirely into the instalment.
| Hypothetical overall rate | Monthly instalment | Monthly difference | Annual difference |
|---|---|---|---|
| 4.00% (starting point) | about 909 euros | — | — |
| 4.25% (+0.25 points) | about 929 euros | about +20 euros | about +240 euros |
| 4.50% (+0.50 points) | about 949 euros | about +40 euros | about +480 euros |
Outside the example, the real references come from ECB press releases: 25 basis points is the size of each of the two 2026 hikes, 0.50 points the cumulative increase in the deposit rate between June and September. Transmission to Euribor is never one-to-one nor immediate: the example measures an order of magnitude, not the instalment of a real contract.
Those looking for a new mortgage
Those looking for a new mortgage choose between two formulas that respond to different variables. The variable rate starts from Euribor, and therefore from expectations of short-term ECB rates. The fixed rate is generally based on long-term swap rates (Interest rate swap, IRS), which incorporate expectations over many years and are affected by bond markets.
In a phase in which the ECB has raised rates to counter an energy shock, the two prices can move differently, and neither formula is advantageous a priori. Three confirmed facts help frame the choice:
- the ECB does not pre-commit to a rate path (press release of 10 September 2026): the path of the variable rate in the coming months is not written;
- financing conditions tightened between September and October (press release of 29 October 2026): credit has become more expensive even without new moves;
- inflation at 4.0% in the euro area and 5.6% in Italy in October 2026 (Eurostat) weighs on disposable income, that is, on the ability to sustain an instalment over time.
When comparing offers, the reference indicator is the TAEG (annual percentage rate of charge), which includes fees and ancillary costs in addition to the rate. For a variable rate, the calculation example above offers a way to measure how much a half-point increase in the index weighs on the instalment.
What happens to BTP yields
The yield on Buoni del Tesoro poliennali (BTPs) depends on three components: the ECB rates expected over the life of the bond, expected inflation and the premium investors demand for Italy risk, measured by the spread against the German Bund. How to read that differential is explained in the guide to the BTP-Bund spread.
An ECB that sees upside risks to inflation and Italian inflation at 5.6% in October 2026 act, by construction, on the first two components. The international picture of sovereign yields, with the role of oil and inflation, is reconstructed in our article on the global bond sell-off.
Levels on 12 November 2026. At the Treasury auction that day, according to the Bank of Italy press release, the 3-year BTP (maturing 15 September 2029) was placed at a gross yield of 3.58% and the 7-year BTP (maturing 15 September 2033) at 4.04%, respectively 11 and 21 basis points lower than at the auctions of 13 October; the 20-year BTP Green (maturing 30 April 2046) at 4.73%. On the secondary market, according to ANSA, at the close of the same day the 10-year BTP yield was just under 4.39% and the spread over the German Bund was 104.4 basis points. Compared with the October auctions, the Treasury's funding cost therefore fell at both the 3- and 7-year maturities.
The effects are distributed differently depending on who is looking:
- holders of fixed-coupon BTPs: when yields rise prices fall, and the loss materialises only if the bond is sold before maturity; those who hold it to the end collect coupons and nominal principal, but a coupon below current inflation produces a negative real return;
- buyers of new bonds: a higher-rate cycle means higher issue coupons;
- the State: higher yields increase over time the cost of new issues and of rolling over maturing bonds, a theme that adds to the constraints of the public accounts notified by Istat.
Dates to mark
- Wednesday 18 November 2026: Eurostat publishes the full October inflation data, with the breakdown by component; watch energy, services and underlying inflation, steady at 2.5% in the flash estimate;
- Wednesday 16 and Thursday 17 December 2026: monetary policy meeting of the ECB Governing Council in Frankfurt, with decision and press conference on 17 December;
- Wednesday 3 and Thursday 4 February 2027: next meeting of the Governing Council.
Until 17 December the signals to follow are those the ECB itself indicated on 29 October: the duration of the energy shock, the reaction of wages, the resilience of underlying inflation and the evolution of financing conditions.
Sources
- ECB – Monetary policy decisions, 10 September 2026
- ECB – Monetary policy decisions, 29 October 2026
- ECB – Key ECB interest rates
- ECB – Monetary policy decisions, 11 June 2026
- Eurostat – Euro area annual inflation up to 4.0% (flash, 4 November 2026)
- ECB – Governing Council meeting calendar
- ECB – Economic Bulletin Issue 7, 2026
- ECB – Account of the meeting of 9-10 September 2026
- Banca d'Italia – ECB Economic Bulletin no. 6/2026
- Bank of Italy – Results of the BTP auctions of 12 November 2026
- Eurostat – Annual inflation up to 3.8% in the euro area (September 2026)
- Eurostat – Inflation in the euro area, Statistics Explained
- De Nederlandsche Bank – ECB interest rates
- ANSA – BTP-Bund spread closes higher at 104.4 basis points, 12 November 2026
Disclaimer: this article is for information purposes only and does not constitute financial advice. Any investment decision should be assessed against your own circumstances and, if needed, with a qualified professional.