
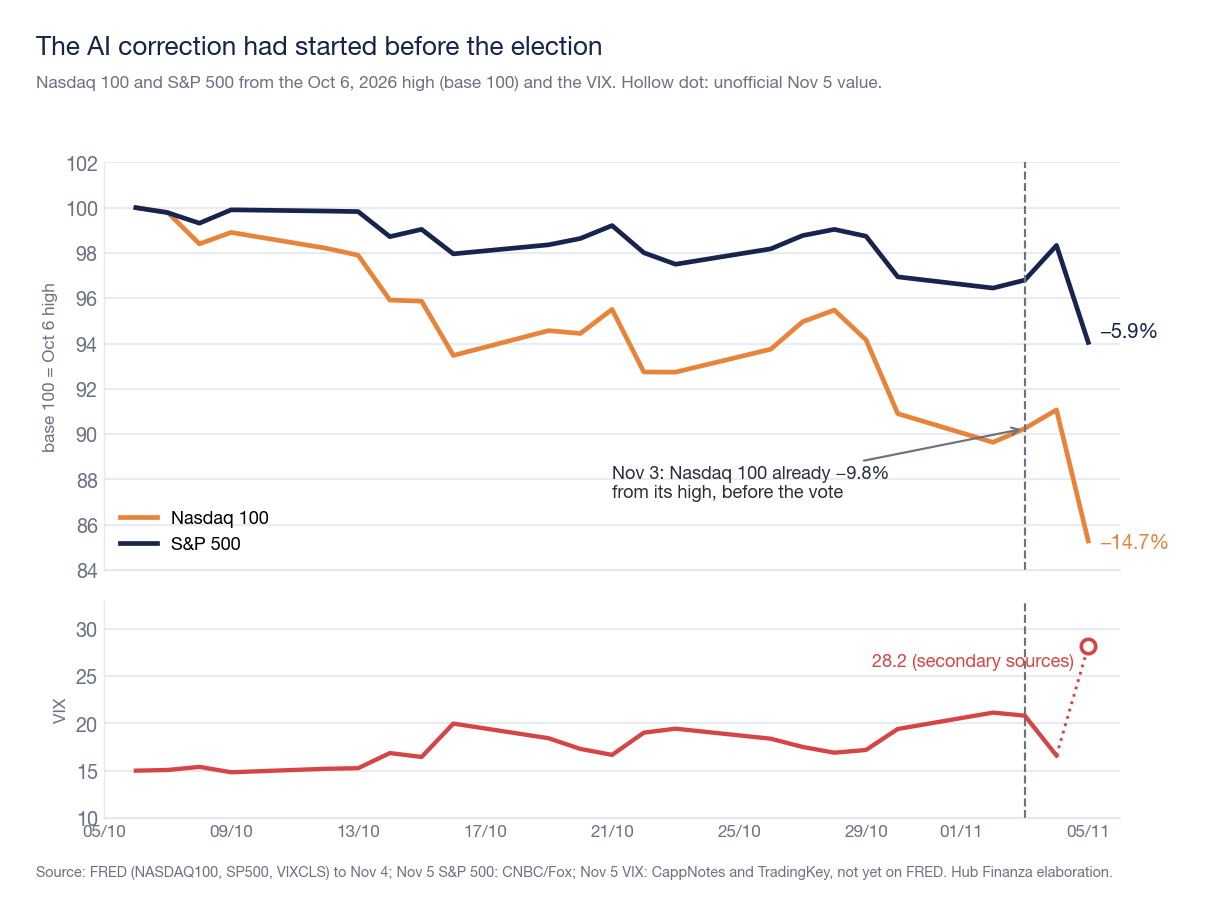
On Thursday, November 5, 2026, the S&P 500 lost 4.36%, its worst session since April 2025, two days after a vote that gave the Democrats the House and Senate. Data indicates the polls were the trigger, not the cause: the Nasdaq 100 had lost 9.8% from its record.
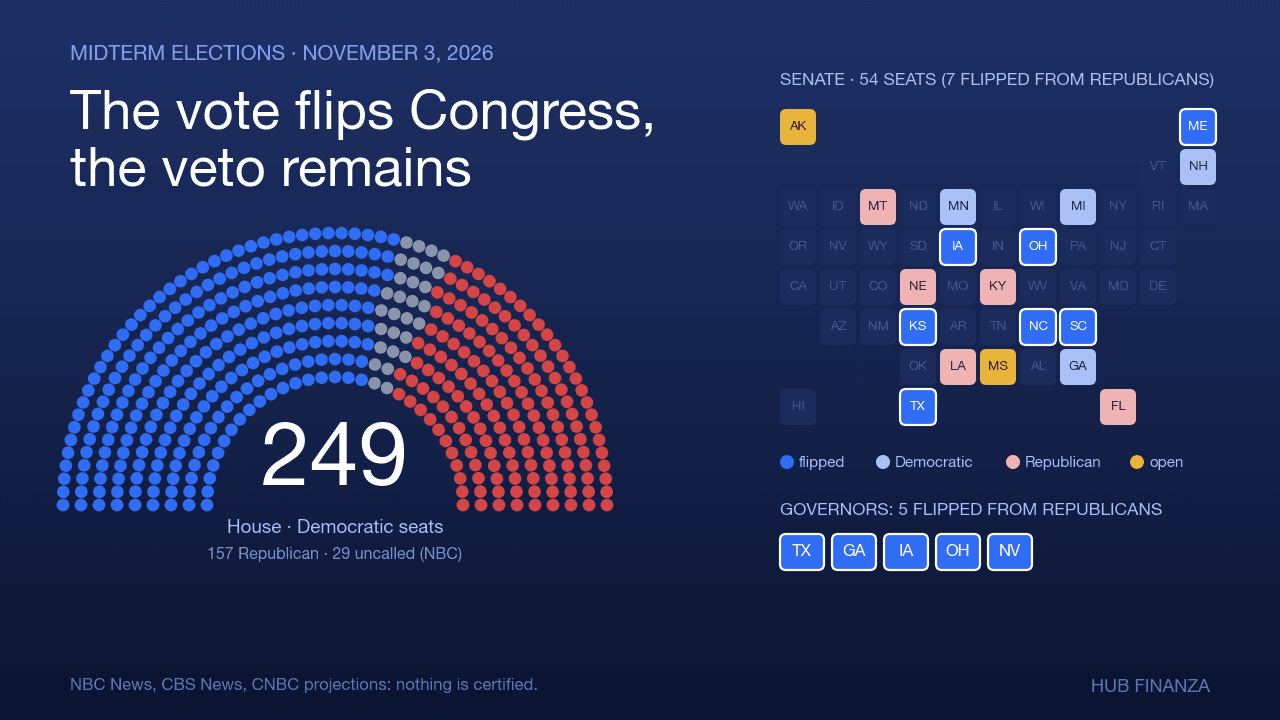
The political picture, in summary: Democrats won the House (249 seats assigned according to NBC News, CBS estimate 256) and the Senate (54 seats), with five governors taken from the Republicans. These are projections, no results are certified; those who want voting details can find them in a separate analysis. Here the topic is another: what happened on Wall Street between Tuesday, November 3, and Friday, November 6, and how much of that fall can truly be attributed to the vote.
The thesis is that the election result provided a pretext for a correction in artificial intelligence-related stocks already underway for a month, in a concentrated market with high leverage. Methodological notes: November 5 data are preliminary closings; where an official value (FRED, Federal Reserve Bank of St. Louis) was not available, we state it. We were unable to read the consulted Bloomberg articles (access denied) nor the text of the Kobeissi Letter thread, which X does not make downloadable: we report its theses from third-party republications.
On Wednesday the market welcomed the vote, on Thursday it sold
Tuesday, November 3, election day, the S&P 500 closed at 7,568.92 (+0.36%) and the Nasdaq 100 at 28,180.26: already 9.8% below the October 6 high (31,224.69). Results came in overnight and Trump declared he accepted them. Wednesday, November 4 the reaction was one of relief: S&P 500 at 7,688.62 (+1.58%), Nasdaq Composite at 25,736.51 (+1.44%), Dow Jones up over 1,500 points, the best day since April 2025. Brent fell 8.7% to 94.62 dollars, the VIX dropped from 20.83 to 16.61, and the high-yield bond spread to 3.32 percentage points. Thomas Hempell of Generali Investments attributed the rise to Trump's acknowledgment of the Democratic victory. It was a rally due to political stalemate: fewer economic policy shocks ahead.
Thursday, November 5 the picture reversed. Overnight, Asian markets had suffered sharp losses in chip stocks (Kospi -5.3%) and the Bank of England had raised rates to 4%. At the open, the Dow gained 334 points and the S&P 500 lost about 0.3%; by 10:35 AM (New York time) the Nasdaq was down about 4% and the S&P 500 2.3% (Yahoo Finance report). In the afternoon, the Nasdaq broke below its 200-day moving average for the first time since April 2025, and the VIX index touched an intraday high of 28.09 at 1:57 PM. At closing: S&P 500 at 7,353.73 (-4.36%), Nasdaq Composite at 24,315.00 (-5.52%, 11.9% below its record), Nasdaq 100 at 26,629.81 (-6.36%), Dow Jones at 51,523.06 (-1,833 points, -3.44%), Russell 2000 -4.45%. All eleven S&P 500 sectors closed in negative territory, with 419 stocks down and 84 up in the afternoon.
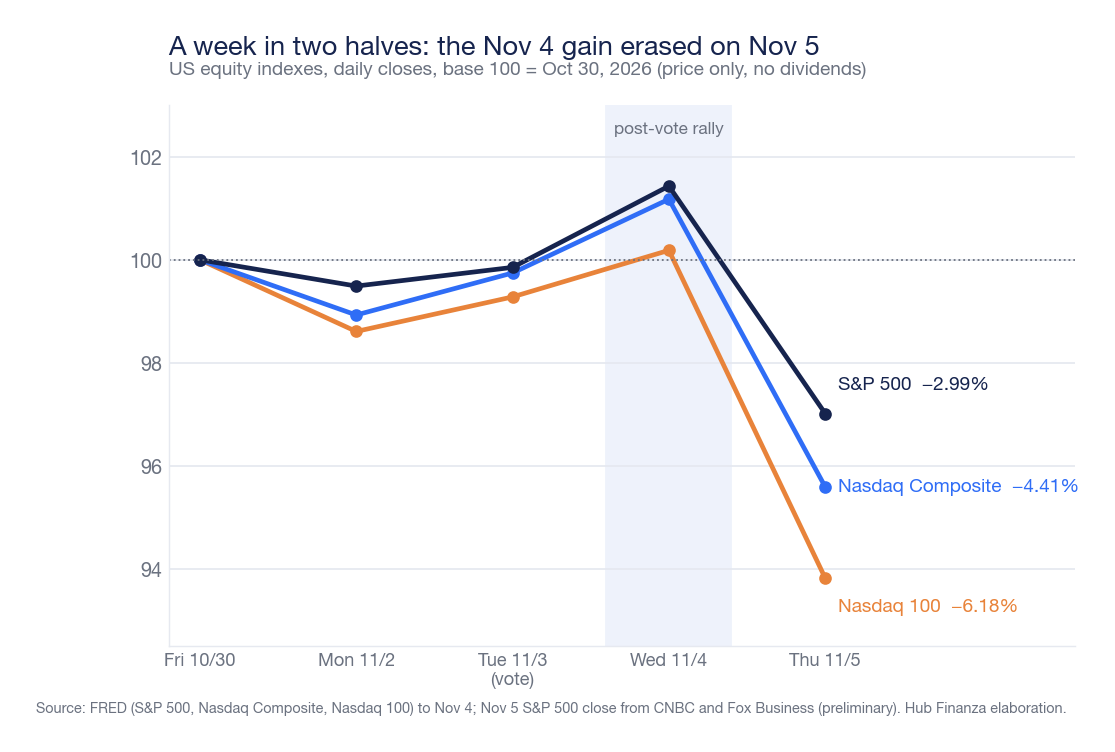
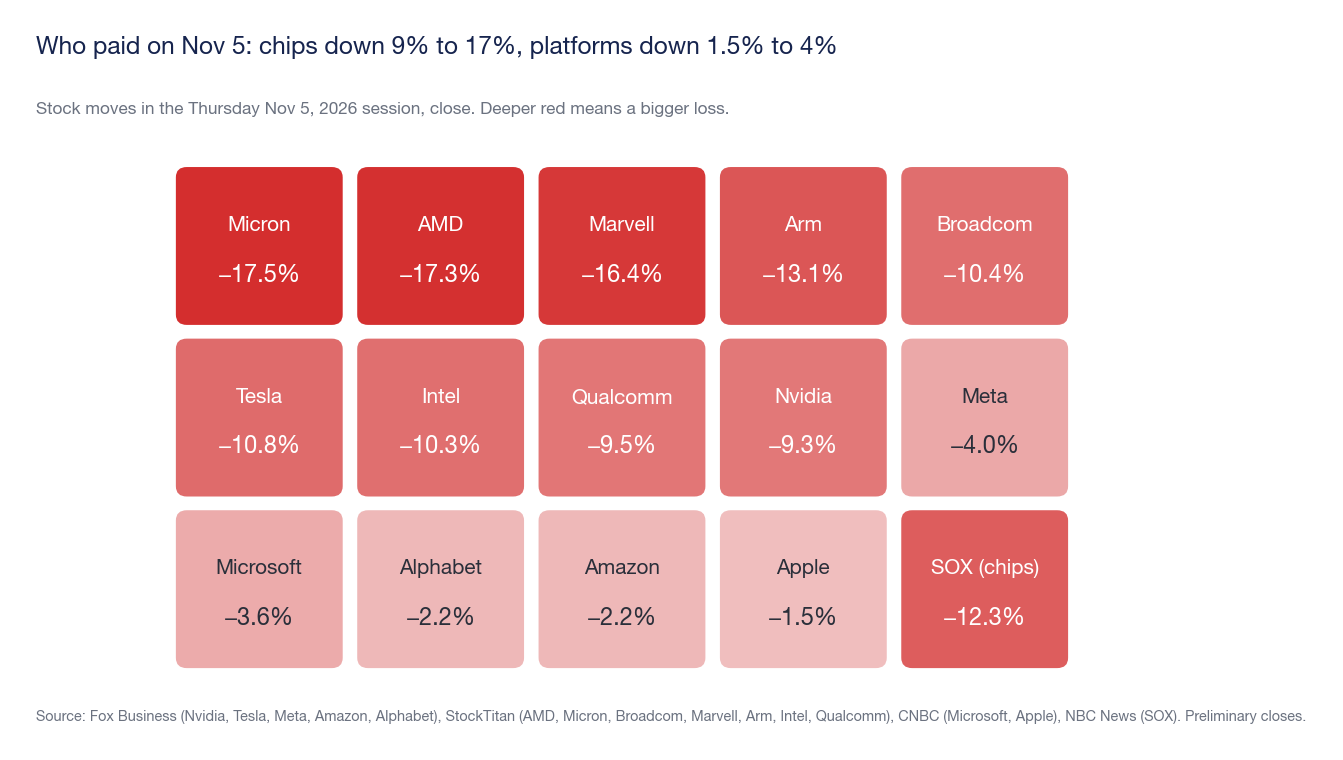
Chips paid the most. The SOX semiconductor index lost 12.3% (NBC News, Fox Business), its worst session since March 2020; Nvidia gave up 9.26% (181.60 dollars, about 440 billion dollars in market capitalization, according to CNBC), Micron 17.5%, AMD 17.3%, Broadcom 10.4%, Arm 13.1%, Qualcomm 9.5% despite earnings above estimates, due to weak guidance related to component costs. Tesla lost 10.8%. Large platforms were less affected: Meta -4.0%, Microsoft -3.6%, Alphabet and Amazon -2.2%, Apple -1.5%. According to CNBC, the Magnificent Seven collectively lost between about 900 and over 1,000 billion dollars; Benzinga estimates about 3,000 billion in capitalization burned from the S&P 500, while other sources indicate lower figures.
Friday, November 6 the shock spread to Asia: the Nikkei 225 closed at 57,434.77 (-5.96%), the Taiex at 39,701.64 (-4.51%, and according to Reuters the worst week since 1991, with -12.2%) and the Kospi fell about 6% to 5,059.69 after a trading halt, triggered by an 8% drop. At 4:59 AM New York time, Nasdaq 100 futures showed +1.7%, Dow futures -0.6%. The October employment report (consensus: +59,000 jobs, unemployment at 4.2%) was released at 8:30 AM New York time: at the time of writing we do not have verified data and do not include it.
One of the heaviest sessions since 2020? The numbers say: yes for chips, less for the S&P 500
For historical comparison, we recalculated daily changes from official closings published by FRED from January 2, 2020, to November 5, 2026 (for the S&P 500 the series goes up to November 4; the November 5 closing is that reported by CNBC and Fox Business). The S&P 500 at -4.36% is the worst session since April 4, 2025, but in the series since 2020 there are ten worse sessions: five in March 2020 (between -4.89% and -11.98%), two in April 2025 (-5.97% on April 4 and -4.84% on April 3), the -5.89% on June 11, 2020, and two other drops between -4.4% and -4.5%. It is the eleventh in the entire period. The Nasdaq Composite at -5.52% is the sixth worst. The Nasdaq 100 at -6.36% is the fourth, and the worst since March 2020: higher than the -6.07% on April 4, 2025.
| Index | Change on 11/5/2026 | Position in the series since 2020 | Heaviest since… |
|---|---|---|---|
| S&P 500 | -4.36% | 11th worst | April 4, 2025 (-5.97%) |
| Nasdaq Composite | -5.52% | 6th worst | April 3, 2025 (-5.97%) and April 4, 2025 (-5.82%) |
| Nasdaq 100 | -6.36% | 4th worst | March 9, 2020 (-6.83%) |
| Semiconductors (SOX) | -12.3% (NBC, Fox) | not recalculated | March 2020, according to NBC and Fox |
The VIX warrants a caution: the official November 5 index was not yet on FRED. Two secondary sources (CappNotes and TradingKey) indicate a close at approximately 28.18, up about 70% from 16.61; if confirmed, it would be the second largest daily increase in the series since 2020 after the +74% on December 18, 2024. There is no contradiction with the intraday high of 28.09 recorded by CNBC at 1:57 PM, because the session continued until 4 PM.
Trump wrote on Truth Social that the market experienced "one of the worst days in history" due to the vote. On "worst ever" the data is clear: in the period since 2020 alone there are ten worse sessions for the S&P 500. For attribution to the vote, see the following section.
Did the vote cause the crash? Six hypotheses tested
A temporal correlation is not a cause. The same result, known on Tuesday night, made the S&P 500 rise 1.58% on Wednesday and fall 4.36% on Thursday. Furthermore, before the vote, JPMorgan assigned 66% to its "blue wave" scenario, with an effect on the S&P 500 between -0.25% and +0.5%: essentially neutral. Here's how the six circulating explanations hold up.
| Hypothesis | What supports it | What weakens it | Judgment |
|---|---|---|---|
| 1. Political risk on AI | Sanders calls on X for a national moratorium on data centers; Hinojosa, elected governor of Texas, promises to halt state authorizations; for the CNBC poll, 56% of voters consider AI and data centers an important factor and 65% of these voted Democratic; on local ballots, opponents prevail in 40 out of 41 questions (CNBC; other sources count fewer jurisdictions, scrutiny in progress); UBS: up to one third of new capacity planned for 2028 could be delayed if pauses extend | Goldman Sachs and JPMorgan: federal moratorium unlikely or stopped by veto; CIBC: most planned data centers will be built; Democrats take office in January; on Wednesday the same result had made the market rise | Plausible trigger, weak sole cause |
| 2. Taxes and tariffs | No consulted source indicates it as a driver on November 5; on Wednesday the reading was that stalemate reduced economic policy shocks | The 2027 debt ceiling is a future risk | Not supported by data |
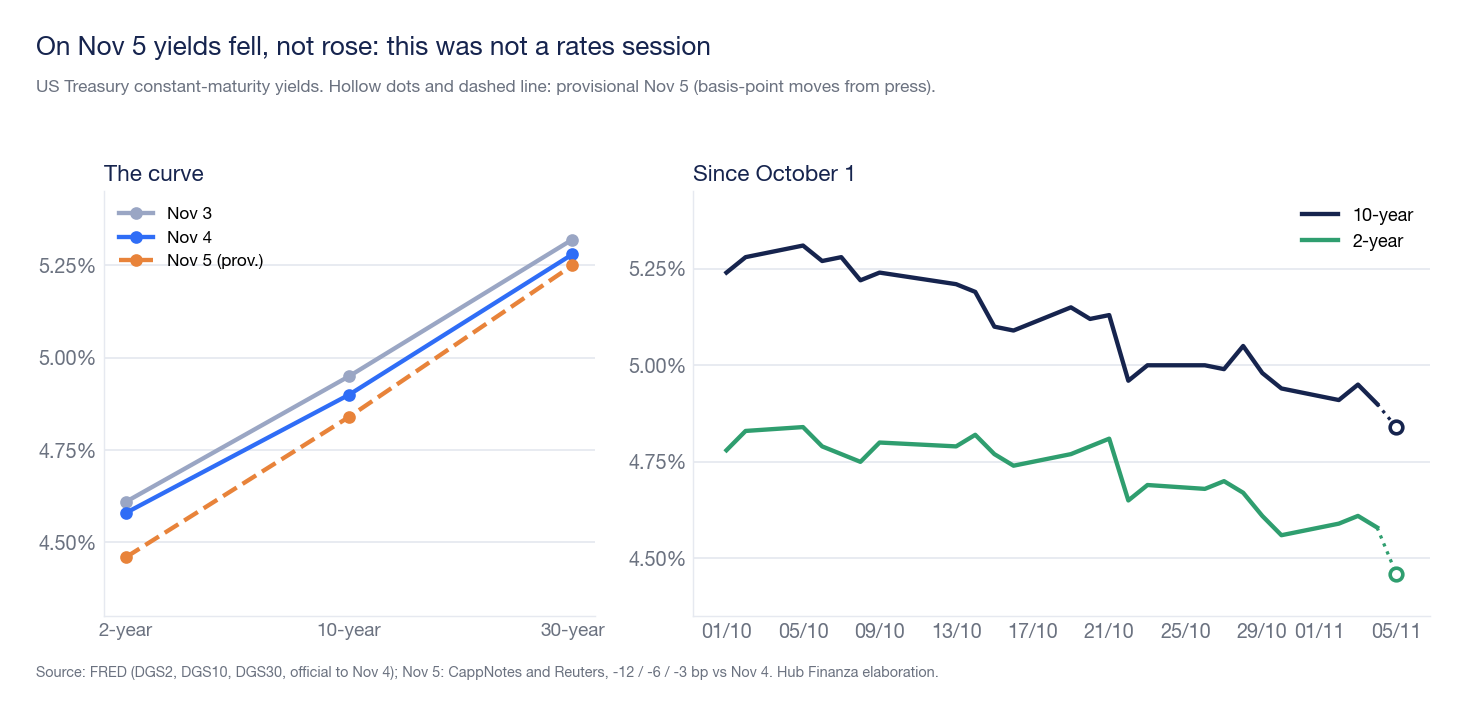
| 3. Rates and Fed | The Fed raised in September (3.75-4.00%); high rates hinder fundraising for small AI infrastructure companies (Reuters) | Yields falling: 2-year at approx. 4.46% (-12 basis points), 10-year at approx. 4.84% (-6), expected inflation 2.24% (FRED); probability of a December 9 hike from 82.7% to 70.1% (CME FedWatch, via CNBC; NBC reports approx. 60%) | Context, not trigger |
| 4. AI valuations, earnings, and returns | AI stocks already falling before the vote (Kobeissi Letter: -13% in October vs +8% for S&P 500 ex-AI; Goldman Sachs via Reuters: AI basket -15% in October, over 24% below high); Qualcomm gave weak guidance for memory costs; Nasdaq 100 already -9.8% on November 3; CoreWeave five-year CDS at historical highs (Reuters) | Arm beat expectations and lost 13%; Nvidia earnings (November 17, date confirmed by company) are not yet out | The explanation with most corroboration |
| 5. Positioning and leverage | Charlie McElligott (Nomura): year-end profits on 2026 leaders; Vanda Research: net sales by small US savers largest since 2020; Reuters: margin calls and forced liquidations in Asia; Kobeissi Letter: record inflows into leveraged ETFs in October (+15 billion, unverified) | No aggregated data on margin debt | Probable amplifier, not measurable |
| 6. Geopolitics and energy | Brent at 98.29 dollars (+3.8%) after -8.7% on Wednesday; Rapidan Energy estimates 80% probability of renewed fighting with Iran | NBC explicitly states oil was not a cause | Underlying context |
The explanation that best fits the data is composite. A correction in AI-related stocks was already underway for a month, in a market concentrated in a few names and in a sector whose valuations discounted a lot of growth. The vote provided a pretext, and the data center issue made it credible, in a system with high leverage. This is the synthesis emerging from sources that contradict each other only superficially: NBC, Fox Business, CNBC, and Reuters indicate political risk as the fuse; the Kobeissi Letter, Nomura, and TradingKey speak of a more technical than fundamental fall. The weak point of political explanations is the chronology; that of technical explanations is that they explain how, but not why on Thursday and not on Wednesday.
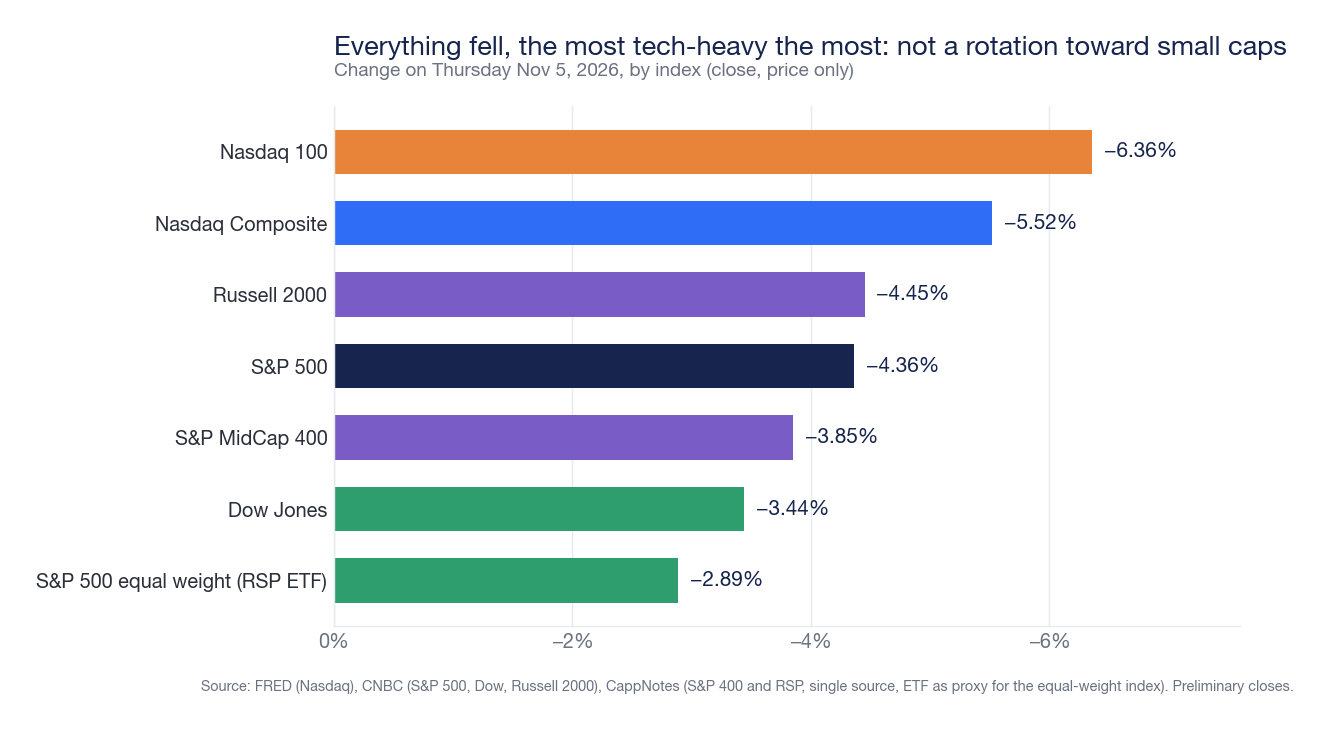
The comparison between indices says the same thing. The equally weighted S&P 500 lost 2.89%, compared to 4.36% for the capitalization-weighted one: the 1.5-point difference is the price of concentration in the few giants. But the Russell 2000, which has very little technology, fell 4.45%, more than the S&P 500: it was not an orderly rotation towards small businesses, but rather a generalized reduction of risk, harsher where AI weighs more heavily. Sector data do not coincide between sources: for technology it ranges from -5.5% to -8.0% depending on the source, and the only complete table (CappNotes, sole source) gives communications -0.6%, utilities -0.7%, and consumer staples -0.8% as the least affected sectors. To understand why a stock can crash even when beating estimates, like Arm and Qualcomm, we refer to our analysis on AI quarterly reports in October and, for those who want to understand how underlying mechanisms work, to the guide on what moves stock markets.
Credit, at least until Wednesday, November 4, did not confirm the panic scenario: the spread of high-yield corporate bonds was at 3.32 points and that of investment grade at 0.91, both down compared to October 30 (3.44 and 0.94). The November 5 data was not yet published when we wrote. The dollar showed uncertain behavior: the dollar index was at 101.60 (+0.09%, sole source), meaning it did not act as a safe haven; according to Saxo (Charu Chanana) the dollar weakens if fiscal stimulus is scaled back, according to Monex (Jesper Koll) it strengthens if Fed independence is defended. Gold closed between 4,090 and 4,100 dollars per ounce depending on the source (+0.5-0.6%, with an intraday high of 4,155.80); Bitcoin fell about 5.7% to 75,855 dollars, with ETF outflows of 430-530 million dollars.
Capital rotation: what can change and what is already priced in
This is not a recommendation to buy or sell: it is a map of the channels through which the new political equilibrium could shift flows, what has already been observed, and what would disprove the thesis. November 5 prices mainly reflect a reduction in risk, not a demonstrated rotation.
| Area | Channel | Already observed | What would disprove it |
|---|---|---|---|
| Technology and large caps | Concentration on AI, regulatory risk on data centers, energy cost (PJM auction on December 9-15) | SOX -12.3%; S&P 500 equal weight -2.89% vs -4.36%; CIBC sees cloud and software more protected than hardware | Federal moratorium deemed unlikely by Goldman; Nvidia earnings on November 17 |
| Small businesses and value | Sensitivity to rates | Russell 2000 -4.45%, more than S&P 500: not a rotation | A Fed hike on December 9 |
| Financials | Limits on card rates (Evercore), oversight | JPMorgan -4% on November 5; 10-2 year curve at +0.38 points (FRED) | A flattening of the curve |
| Industry and defense | Budget: 1,500 billion requested versus approx. 1,150 in the House proposal (estimate attributed to Jefferies, secondary source) | Defense -3/-5% on November 4, Caterpillar -6% on November 5; Wells Fargo: stable to modestly growing earnings | A partial government shutdown |
| Energy and renewables | Crude oil price; reduced incentives remain in effect without a bill signed by the president | Energy (XLE) -4.74% on November 4; First Solar +9.4%, Sunrun +10% (Investing.com) | Brent over 100 if fighting resumes (Rapidan: 80%) |
| Healthcare | ACA subsidies expired December 31, 2025, sector tariffs on drugs | Centene +4.5%, Molina +6% (Investing.com, secondary source) | Requires president's signature |
| Consumption and trade | Cost of living, gasoline at 4.12 dollars; effective tariff rate at 7.1% (Penn Wharton) | Discretionary -3.8%, defensive between -0.6% and -0.8% (CappNotes, sole source); 126 billion certified refunds out of 166 collected | New sector tariffs; China truce expiration on January 10 |
| Treasury and duration | Fed hiking, deficit of 1,992 billion, debt ceiling in 2027 | 10-year from 5.31% (October 5) to 4.90% (November 4) and approx. 4.84%; 2-year from 4.58% to approx. 4.46%; 30-year 5.28%; 10-year real rate 2.64% (FRED) | Hike on December 9; October CPI on November 10. Lombard Odier: yields typically -20/-25 basis points after midterms (secondary, unverified) |
| Credit, dollar, gold, oil | AI spending on debt; Fed vs fiscal stimulus; Iran | HY 3.32 and IG 0.91 on November 4 (FRED); dollar unchanged; gold between 4,090 and 4,100; Brent 98.29; Bitcoin -5.7%. Emerging currencies: data not found | A widening of spreads after November 5 |
Three scenarios and what would change them
Probabilities are not invented: where a number exists, it is attributed. According to LPL Research, since 1950 the S&P 500 has returned an average of +15.1% in the twelve months after a midterm election, with all nineteen cases being positive (from +1.1% to +33.2%). Nineteen observations do not make a model, and this cycle starts with a Fed raising rates, a 10-year yield near 5%, and a Nasdaq in correction; Jonathan Krinsky of BTIG warned that a post-election rally is less likely than consensus. Among attributable forecasts: Mike Wilson of Morgan Stanley saw a drop towards 7,100 before the vote and then a recovery to 8,000; Matthew Aks of Evercore ISI indicated 6,800 by year-end if Trump intensified the conflict with Iran and Democrats took Congress. The S&P 500 closed on November 5 at 7,353.73.
| Scenario | Conditions | To monitor and signals | Tendentially favored or penalized |
|---|---|---|---|
| Bullish: stabilization and return of risk | Nvidia earnings (November 17) confirming demand; Fed does not hike on December 9; oil below 100 dollars | October CPI (November 10), revised GDP (November 25), FedWatch probabilities, HY spreads. Confirmation: falling yields and VIX with chips rebounding; disproof: widening spreads. Anchor: Morgan Stanley, recovery to 8,000 | Favored: chips and small rate-sensitive companies; less so: defensives |
| Central: consolidation and reallocation of flows | Nasdaq stable below October high; AI narrows to cash flow-positive groups; Washington stalemate without shocks | Funding deadline (December 11), inauguration (January 3), Alaska and Mississippi. Confirmation: equal weight does not lose ground; disproof: new chip crash. Anchor: Morgan Stanley, descent towards 7,100 | Favored: software and cloud; less so: hardware and indebted infrastructure |
| Bearish: deterioration or new corrections | Resumption of fighting with Iran and Brent over 100; Fed hikes and pushes yields towards 5%; doubts about AI returns | Payroll, CPI, Treasury auctions, CoreWeave and SoftBank CDS, truce with China (January 10). Confirmation: rising spreads and yields with falling stocks; disproof: Brent retracing. Anchor: Evercore, 6,800 | Favored: gold and short maturities; penalized: small caps, high yield, businesses exposed to trade |
Tactical and strategic. In the short term, dates matter: CPI on November 10, Nvidia earnings on the 17th, second GDP estimate on the 25th, Fed on December 8 and 9, federal funding deadline on the 11th, PJM auction with results on the 22nd. On the strategic level, the issue is not the vote but three variables that the vote does not decide: the cost of money, the actual return on AI investments, and the price of energy. For reasoning on concentration and diversification, see the guide to ETFs; for credit mechanisms related to AI, the analysis on Nvidia and AI investment circles; for the Fed, the September 16 hike.
What we could not verify
- Official closing of the VIX, Treasury yields and credit spreads on November 5, euro-dollar and dollar-yen exchange rates, Ether, silver, Oracle, volumes compared to average, concordant sector table, and a reliable intraday chart: not available or conflicting among sources. For this reason, the intraday chart and sector table do not appear.
- The consulted Bloomberg articles were inaccessible; Financial Times and Wall Street Journal did not emerge from the search. Interpretations come from Reuters, CNBC, NBC News, Fox Business, Yahoo Finance, and Kobeissi Letter (via republications by gokhshtein.com and CryptoSlate).
- The October employment report, released on Friday, November 6, is not included. The political picture cited at the beginning consists of projections, not certified results.
Sources
Market series from daily SP500, NASDAQCOM, NASDAQ100, VIXCLS, DGS2, DGS10, DGS30, T10YIE, BAMLH0A0HYM2 and BAMLC0A0CM series of the Federal Reserve Bank of St. Louis (FRED); November 5 closings from CNBC, Fox Business, NBC News, StockTitan, CappNotes and TradingKey (preliminary data). Session chronology from Yahoo Finance and CNBC; Asia from Reuters (via Investing.com) and CNBC. Analyst positions from Reuters, CNBC, Investinglive, LPL Research (via Finwire) and Motley Fool. Implied probabilities on rates from the CME Group's FedWatch tool (via CNBC). Tariffs from Penn Wharton Budget Model. Kobeissi Letter's theses from gokhshtein.com and CryptoSlate; Broad Spectrum's theses (Substack). Political picture from NBC News, CBS News and CNBC. Historical rankings, changes, index ratios and distances from highs are elaborations by the editorial team on the cited data (gen_midterm_2026_charts.py and series in content/dati/midterm-2026-11-06).
This article is for informational purposes only and does not constitute financial advice, investment research, public solicitation of savings, or personalized recommendation to buy or sell. The assessments expressed are the opinions of the editorial team based on public data as of the publication date and may change without notice. The value of investments may decrease as well as increase, and past performance is not indicative of future returns. Before any investment decision, it is advisable to consult a licensed financial advisor and evaluate the consistency of the operation with one's objectives, time horizon, and risk tolerance.