


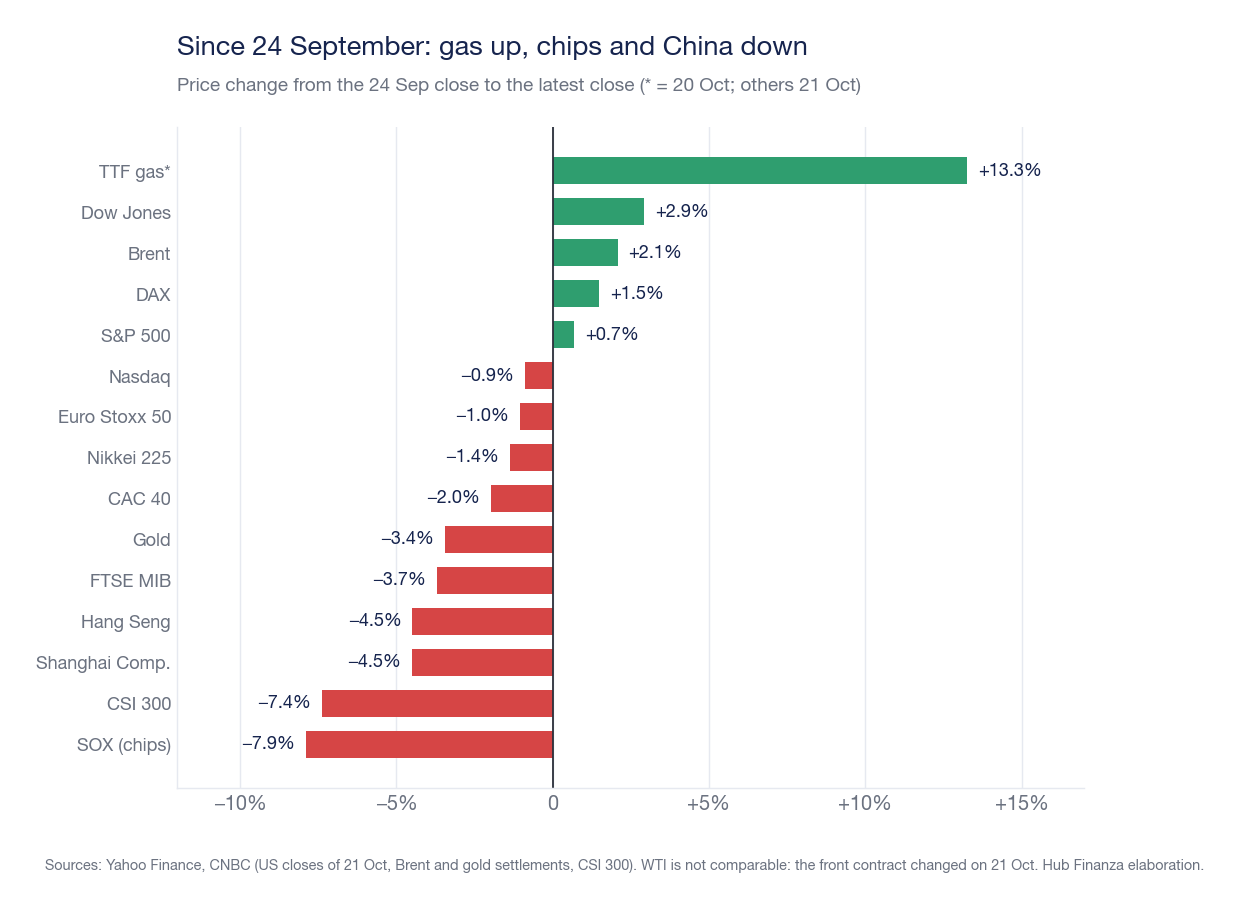
From 24 September to 21 October 2026 the S&P 500 gains 0.7%, but beneath the index semiconductors lose 7.9%, the Chinese CSI 300 7.4% and European gas gains 13.3%. From 28 October, the Fed and BCE decide.
The site was down since 24 September, and this article reconstructs that month starting from the closing prices of that day. Data is updated to 21 October 2026, 10:30 PM Italian time, after the close of Wall Street. All series extend to the close of 21 October, with two stated exceptions: TTF gas, halted on 20 October because we could not find an accessible source for the 21st, and the Bund, which is the Bundesbank's midday reading. All are price indices, without dividends, and each change is calculated between two closing prices, without summing daily returns. We report the causes that sources attribute to the movements as such: a coincidence of dates is not proof.
The month in a table
| Instrument | 24 September | Last close | Change |
|---|---|---|---|
| S&P 500 | 7,704.13 | 7,757.17 | +0.7% |
| Nasdaq Composite | 26,939.37 | 26,702.86 | −0.9% |
| Dow Jones | 51,349.98 | 52,856.09 | +2.9% |
| PHLX Semiconductor (SOX) | 12,492.54 | 11,505.56 | −7.9% |
| Euro Stoxx 50 | 6,272.50 | 6,207.52 | −1.0% |
| DAX | 25,266.53 | 25,645.04 | +1.5% |
| FTSE MIB | 51,543.00 | 49,643.69 | −3.7% |
| Hang Seng | 24,761.13 | 23,651.87 | −4.5% |
| CSI 300 | 4,439.14 | 4,111.93 | −7.4% |
| Nikkei 225 | 65,513.99 | 64,621.24 | −1.4% |
| Treasury 10-year, yield | 5.18% | 5.13% | −5 basis points |
| Bund 10-year, Bundesbank curve | 3.60% | 3.44% (midday) | −16 basis points |
| EUR/USD, dollars per euro (BCE) | 1.1367 | 1.1234 | −1.2% |
| Brent (December), dollars per barrel | 106.60 | 108.82 (settlement) | +2.1% |
| TTF gas, euros per MWh | 75.11 | 85.06 (20/10) | +13.3% |
| Gold, dollars per ounce | 4,298.00 | 4,150.00 (settlement) | −3.4% |
Sources: Yahoo Finance for series up to 20 October; CNBC for US closes and 21 October settlements and for the CSI 300; United States Treasury for Treasury (par yields); Bundesbank for the Bund; BCE for EUR/USD. Brent, gas, and gold are futures: a contract roll can impact the change, which is why we do not compare WTI, whose main contract changed on 21 October.
Equities: a stalled index and a divided market
The S&P 500 and Nasdaq touched closing highs on 6 October, 7,818.93 and 27,599.79, the highest in the series we downloaded, which starts from 2021. Then the market turned on the sector that had led it: from the high of 6 October (13,217.82) to the low of 16 October (11,137.29), the SOX semiconductor index lost 15.7% in eight sessions, and closes the period at −7.9% compared to 24 September, after a rebound of 1.97% on 21 October.
On 21 October, Wall Street closed higher: S&P 500 +0.58%, Nasdaq +1.05%, Dow Jones +0.69%. We do not have a documented explanation from a primary source. On 14 October, the day September's US consumer prices were released, the S&P 500 lost 1.11%. On the 16th, selling hit chips and software: Nasdaq −2.15%, S&P 500 −1.09%, Russell 2000 −1.66%, according to an aggregator referencing Yahoo closes. The day before, the 15th, the Nikkei had dropped 4.9% at close, from 67,744 to 64,426; the Japan Times, reported by UA.News, states that Advantest fell over 15% during the day. We do not have a single documented explanation from a primary source; reports link the phase to higher-than-expected US inflation and interest rate expectations, which we address later.
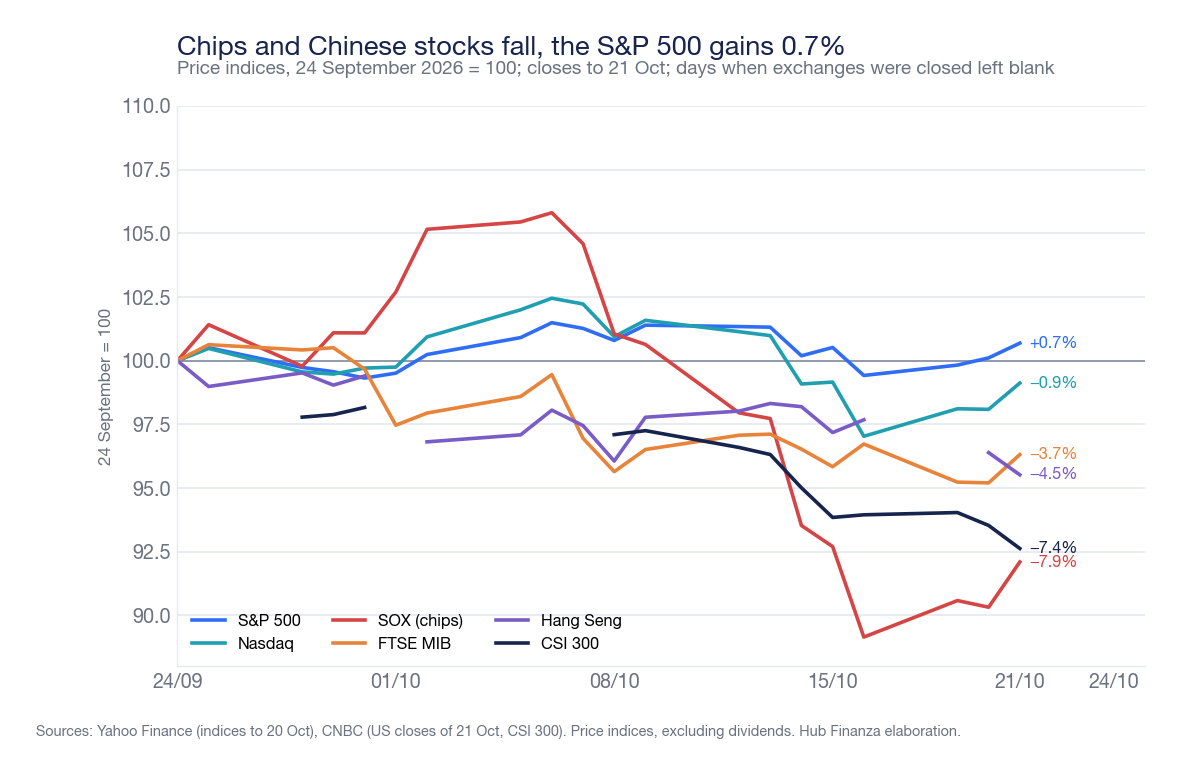
The Dow Jones, more closely tied to industrial and financial stocks, gained 2.9%; according to sector ETF prices, finance rose 2.8% and energy 8.9%, touching its highest level since 2021 on 16 October. In Europe, the picture is divided: the DAX gains 1.5%, the Euro Stoxx 50 yields 1.0%, the CAC 40 2.0% and the FTSE MIB 3.7%. We do not have a documented explanation for the difference between the DAX and FTSE MIB.
Asia is the weaker side. The CSI 300 loses 7.4%, the Shanghai Composite 4.5%, with a 52-week low on 15 October, and the Hang Seng 4.5%; the Nikkei yields 1.4% but from the high of 6 October, 70,684, to the low of 20 October, 64,075, it loses 9.3%. Mainland Chinese exchanges remained closed from 1 to 7 October for the holiday, Hong Kong on 1 and 19 October, Tokyo on 12 October: these days remain empty in the charts.
Bonds and rates: the 10-year US Treasury at 5.31%
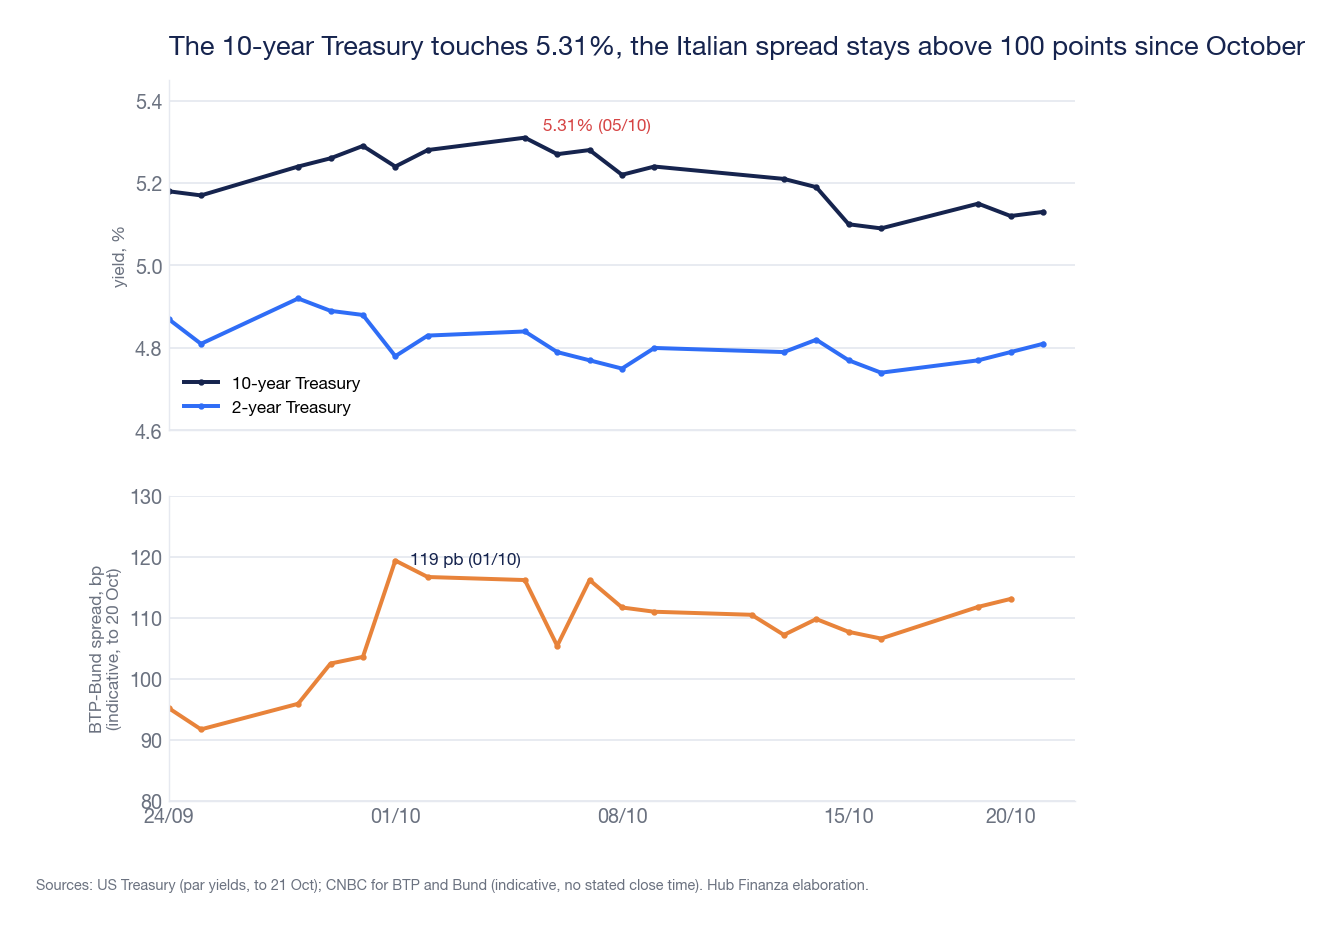
The 10-year Treasury yield, calculated by the Treasury on the par yield curve, was 5.18% on 24 September and 5.13% on 21 October: beneath the surface, however, it touched 5.31% on 5 October, the high for the period and, in the series we downloaded, since 2021. The two-year goes from 4.87% to 4.81%, the thirty-year from 5.47% to 5.42%, after a high of 5.70% on 5 October. The slope between two and ten years is 0.32 points, versus 0.31.
The Federal Reserve, on 16 September, had raised rates by a quarter point, to 3.75-4.00%, with a unanimous vote, as reported in The Fed raises rates again after three years. The minutes, published on 7 October, state that the majority of participants deemed another rate hike probable by year-end. The data that rekindled the issue is inflation: on 14 October, the September consumer price index marked +3.7% year-on-year, against 3.4% in August, and a core rate of 2.6% above the expected 2.5% reported by Newsquawk; producer prices, on 15 October, rose 1.3% month-on-month and 6.3% year-on-year. The labor market, meanwhile, is cooling: 29,000 more jobs in September and unemployment at 4.2%, with July revised to −10,000. A secondary source reports that the probability of an October Fed hike briefly rose to 50% only to fall to 27% after the price publication: we could not verify this reading with a citable source, and thus do not use it for our reasoning.
In Europe, the 10-year Bund yield, measured on the Bundesbank curve, falls from 3.60% to 3.44%, a midday value for 21 October. The 10-year BTP, according to CNBC's indicative data, goes from 4.56% to 4.59% (21 October, 6:54 PM), and the spread against the Bund rises from 95 to 113 basis points on 20 October, with a high of 119 on 1 October; at 6:54 PM on 21 October, it is at about 117. On 6 October, QuiFinanza reported the spread at 116, the French OAT at 4.85% and the Bund at 3.45%. Sources attribute the rise to the wave of selling on government bonds and expectations of a more restrictive monetary policy; to understand what the differential measures, refer to the guide on BTP-Bund spread. Euro area inflation for September was 3.8%, with energy at +18.9%; in Italy, 4.2%. The 10-year Japanese yield falls from 3.08% to 2.89%.
Currencies, energy, gold
With the dollar quoted as a foreign currency unit per euro, EUR/USD goes from 1.1367 to 1.1234, according to BCE reference rates: the euro yields 1.2%. The ICE dollar index rises 0.4% on 20 October. The yuan gains 0.5% against the dollar (from 6.7126 to 6.6761 per dollar, BCE cross) and the yen 0.6% (from 158.85 to 157.88 per dollar, same cross). The Bank of Japan brought the rate to about 1.25% on 18 September, effective from the 24th, with a 7 to 2 vote.
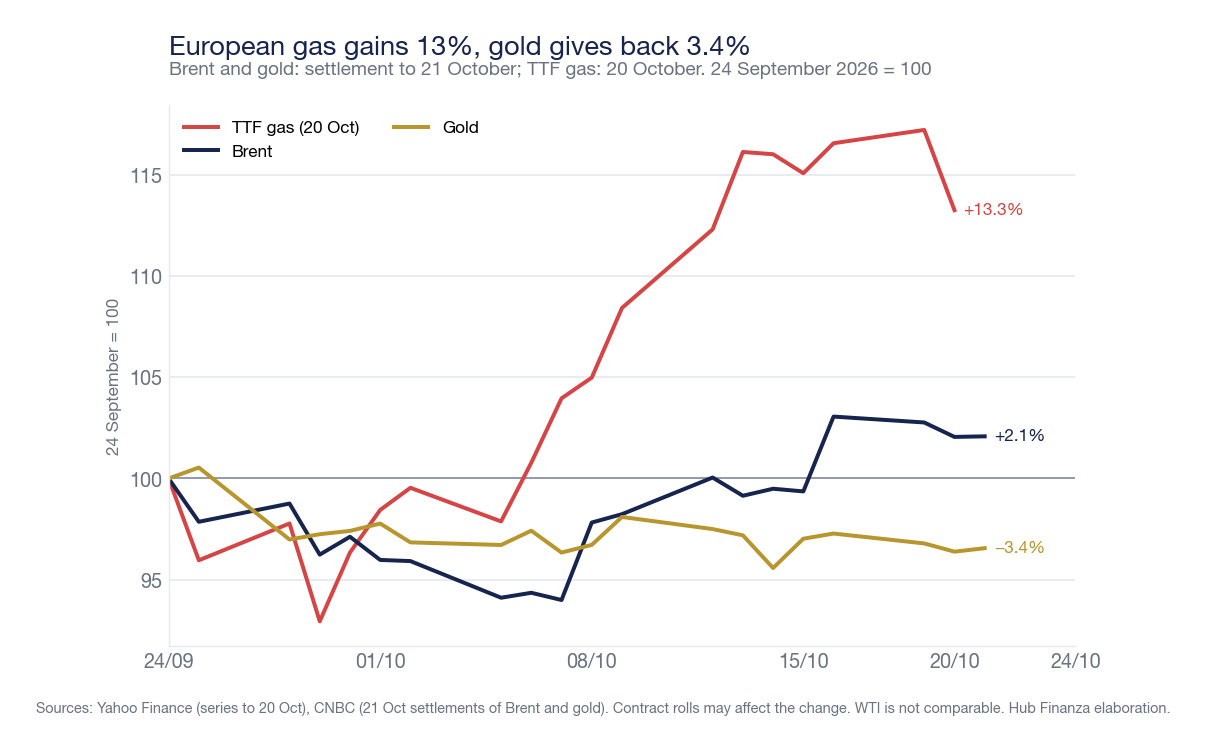
European TTF gas rises from 75.11 to 85.06 euros per megawatt-hour on 20 October (+13.3%), after a low of 69.81 on 29 September and a high of 88.04 on 19 October; for the 21st, we do not have verified data. Brent (December contract) goes from 106.60 to 108.82 dollars (+2.1%, high of 109.86 on 16 October). We do not compare WTI: on 21 October, the main contract shifted from November to December, and the continuous series is not homogeneous. The rise is consistent with what two primary sources write: the Fed minutes attribute part of the inflation to energy prices, which rose due to developments in the Middle East, and the Bank of Japan cites expensive oil. Gold yields 3.4%, from 4,298 to 4,150 dollars per ounce at the 21 October settlement.
Quarterly results already published
Most of the period's results came from US banks and semiconductors. We do not report the comparison with analyst consensus: we could not find a citable and dated source. Those who want to understand why a stock might fall despite growing earnings can find the explanation in the guide on how to read a quarterly report.
| Company | Period and date | Results | Outlook |
|---|---|---|---|
| Goldman Sachs | Third quarter 2026, 13 October | Revenue $18.679 billion (+23% year-on-year); net income $5.294 billion (+29%); earnings per share $17.01 versus $12.25 | No guidance; investment banking backlog down compared to end-June |
| Citigroup | Third quarter 2026, 13 October | Net income $5.245 billion (+40%); revenue $23.845 billion (+8%) | 2026 tangible common equity return target which the company expects to exceed |
| Wells Fargo | Third quarter 2026, 13 October | Net income $5.951 billion (+6%); revenue $21.870 billion (+2%) | No numerical guidance |
| Bank of America | Third quarter 2026, 14 October | Net income $6.933 billion; revenue $29.958 billion; one-time regulatory charge of $1.2 billion | No guidance on net interest margin |
| Morgan Stanley | Third quarter 2026, 14 October | Revenue $20.338 billion (+12%); net income $4.909 billion (+6%) | No guidance |
| ASML | Third quarter 2026, 14 October | Net sales €11.662 billion (€7.516 one year prior); net income €4.960 billion | Fourth quarter €14.2-15.2 billion; year 2026 €44-45 billion |
| TSMC | Third quarter 2026, 15 October | Revenue $46.72 billion (+41.2% in dollars); net income TWD 763.06 billion (+68.7%); gross margin 66.4% | Fourth quarter: revenue $52.3-54.3 billion; gross margin 65-67% |
| Micron | Fourth quarter of fiscal year 2026 (closed 3 September), 30 September | Revenue $54.229 billion; GAAP earnings per share $32.87 | First quarter of fiscal year 2027: revenue $61.5 billion, plus or minus 1.5 |
| Netflix | Third quarter 2026, 20 October | Revenue $12.874 billion (+12%); operating income $4.459 billion (+37%) | 2026 revenue expected at $51.1 billion, slightly below previous range |
| LVMH | Nine months 2026 revenue, 12 October | €57.148 billion (−2% reported, +2% organic); fashion and leather goods −5% | No numerical guidance |
Semiconductor earnings are strong: TSMC reported revenue growth of 41.2% in dollars and forecasts a fourth quarter between $52.3 and $54.3 billion, ASML sold for €11.662 billion compared to €9.326 in the previous quarter, and Micron expects revenue of $61.5 billion in the next quarter. Yet the SOX index loses 7.9%. The period shows that excellent results and falling prices can coexist, and we do not have a source that explains the reason for this divergence: that would be a hypothesis. Among US banks, Bank of America incurred a regulatory charge of $1.2 billion that reduced earnings; the other five closed with growing profits, and JPMorgan's figure ($15.305 billion, +6%) is drawn from a secondary source because the official press release was not opened.
The next seven to ten days
Meta and Tesla published earnings after the 21 October close: they are not included in this article, which stops at market closes, and we comment on them in a dedicated piece. From 25 October, Europe returns to standard time, the United States will do so on 1 November: from 26 to 31 October, there are five hours between New York and Rome, not six. Times are Italian. Dates confirmed by official sources or companies are indicated as such; "to be confirmed" means the date comes from a secondary source or past practice.
| When | Event | What to observe | Status |
|---|---|---|---|
| Friday 23 October, call at 2:00 PM | Eni, third quarter and second dividend tranche | Adjusted net income, production, share buyback | Confirmed |
| Wednesday 28 October, 7:00 PM (press conference 7:30 PM) | Federal Reserve, interest rate decision | After September's hike to 3.75-4.00%: another hike or a pause | Date confirmed by Fed calendar; time is usual |
| Wednesday 28 October, 9:30 PM and 10:30 PM | Alphabet and Microsoft, quarterly reports | Cloud, capital expenditures and artificial intelligence | Confirmed by companies |
| Thursday 29 October, 1:30 PM | United States: third quarter GDP (advance estimate) and September consumer spending with PCE inflation | Growth and prices, the day after the Fed | Confirmed by BEA calendar |
| Thursday 29 October, 2:15 PM (press conference 2:45 PM) | European Central Bank, interest rate decision | After September's hike and inflation at 3.8% | Date and time confirmed by BCE |
| Thursday 29 October, 10:00 PM | Amazon, quarterly report | Cloud (AWS) and margins | Confirmed by company |
| Friday 30 October, 11:00 AM | Eurostat: third quarter euro area GDP, flash estimate | Growth after +0.6% in the second quarter, revised from +0.4% in the flash estimate | Date confirmed by Eurostat calendar; time to be confirmed |
| 29-30 October, decision on 30th | Bank of Japan, meeting with outlook report | Rates and yen, after September's 1.25% | Date confirmed; time not fixed |
| Friday 30 October | Intesa Sanpaolo: board meeting on 30 September accounts and possible interim dividend | Nine-month net income | Date confirmed; time not indicated |
| Saturday 31 October, 2:30 AM | China: official October PMI indices | Manufacturing after September's 50.1 | To be confirmed (secondary source) |
Possible consequences are scenarios, not forecasts. On the Fed, a new hike would confirm the reading of the minutes, which the majority of participants deemed probable by year-end; a pause would leave the rate at 3.75-4.00% and shift attention to October's consumer price data, due out on 10 November. On the BCE, after the 10 September hike to 2.50% on the deposit rate, reported in the 10 September article, the meeting falls on the same day as US GDP. We do not report market expectations due to the lack of a citable and dated source. Consensus expectations should be re-checked the day before each event.
After 31 October, the calendar foresees, according to the sources we have verified, Apple on 2 November at 11:00 PM, the US midterm elections and Ferrari (call at 3:00 PM) on 3 November, euro area flash inflation on 4 November, the Bank of England on 5 November, and US October employment on 6 November at 2:30 PM; UniCredit publishes on 9 November, the original date of 21-22 October has been moved. We will follow the results of major events with articles after their publication, not before.
What follows
Four weeks do not make a trend, but something can be said. The US market did not fall: it changed leadership, with semiconductors down but recovering on 21 October, energy and finance holding up, and a ten-year yield that remains above 5%. High rates and higher-than-expected inflation are the shared theme on both sides of the Atlantic, with the Fed and BCE deciding one day apart. These are the facts; the rest, from why chips fall despite growing earnings to the weight of the Trump-Xi summit on Chinese exchanges, remains without a documented explanation.
Sources
Price series for indices, futures, ETFs, volatility, and exchange rates from Yahoo Finance (closes on 20 and 21 October 2026) and CNBC for CSI 300, BTP, Bund, and Japanese and Chinese yields; Treasury yields from the United States Treasury par yield curve; Bund from the Deutsche Bundesbank curve; European Central Bank reference rates. Macro data from the Bureau of Labor Statistics (2 and 14 October), Federal Reserve (16 September statement, 7 October minutes, calendar), Bureau of Economic Analysis, Eurostat, and BCE; US inflation consensus from Newsquawk. 14-16 October movements from Japan Times via UA.News and an aggregator that references Yahoo closes. Quarterly reports from filings with the SEC (Goldman Sachs, Citigroup, Wells Fargo, Bank of America, Morgan Stanley, ASML, TSMC, Micron, Netflix) and company websites; JPMorgan from a secondary source. Calendar from official websites of central banks, Eurostat, BEA, BLS, and company investor relations pages. Percentage changes and basis points are editorial calculations based on cited closing values. The complete log, with sources and limitations, is in the internal editorial recovery report.
This article is for informational purposes only and does not constitute financial advice, investment research, public solicitation of savings, or personalized recommendation to buy or sell. The assessments expressed are editorial opinions based on public data at the date of publication and may change without notice. The value of investments may decrease as well as increase, and past performance is not indicative of future results. Before making any investment decision, it is advisable to consult a qualified financial advisor and evaluate the consistency of the operation with one's objectives, time horizon, and risk tolerance.